Tag Archives: obama

Myths Exposed: President Obama is Responsible for Historic U.S. Federal Debt and Spending Levels

The far right in the U.S. has been desperately trying to convince the electorate that President Obama is spending the U.S. into oblivion and driving up the debt.

Here are the facts…

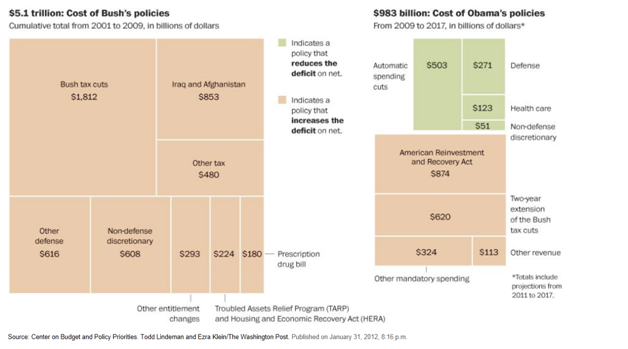
The Washington Post and Center on Budget and Policy Priorities compiled this chart:

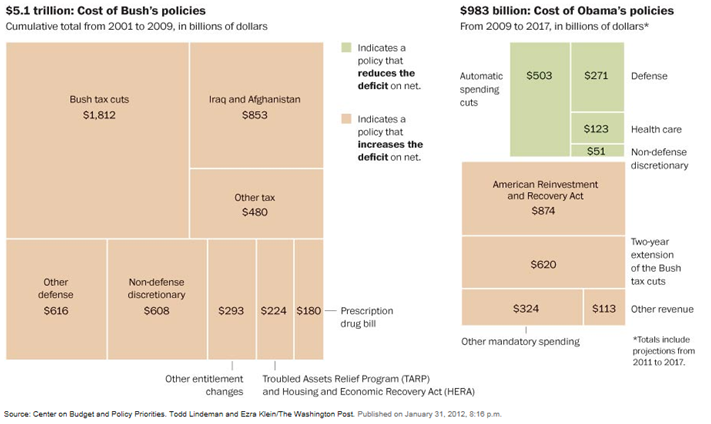
This chart shows the debt directly attributed to President Bush and President Obama. Much of the recent debt came from the Bush tax cuts.

Let’s look into the debt further…

This blog post states the following:

During 20 years of the presidencies of Reagan, Bush I and Bush II, the federal debt as a share of GDP increased by a cumulative 43% of GDP. During the 4 first years of the Obama presidency, it has increased by 36% of GDP.

This is how the Presidents rank in terms of development of the Debt/GDP ratio per year of tenure:

1. Clinton -1% per year
2. Reagan, Bush II: +2% per year
3. Bush I: +3% per year
4. Obama: +9% per year.

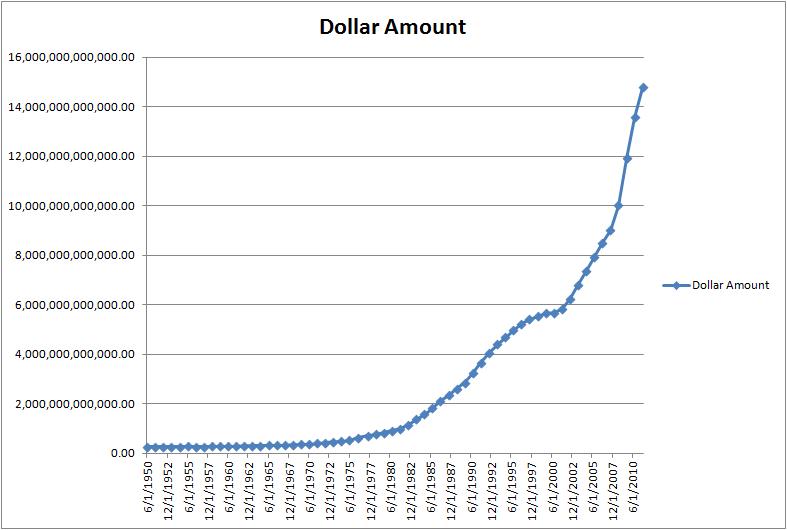
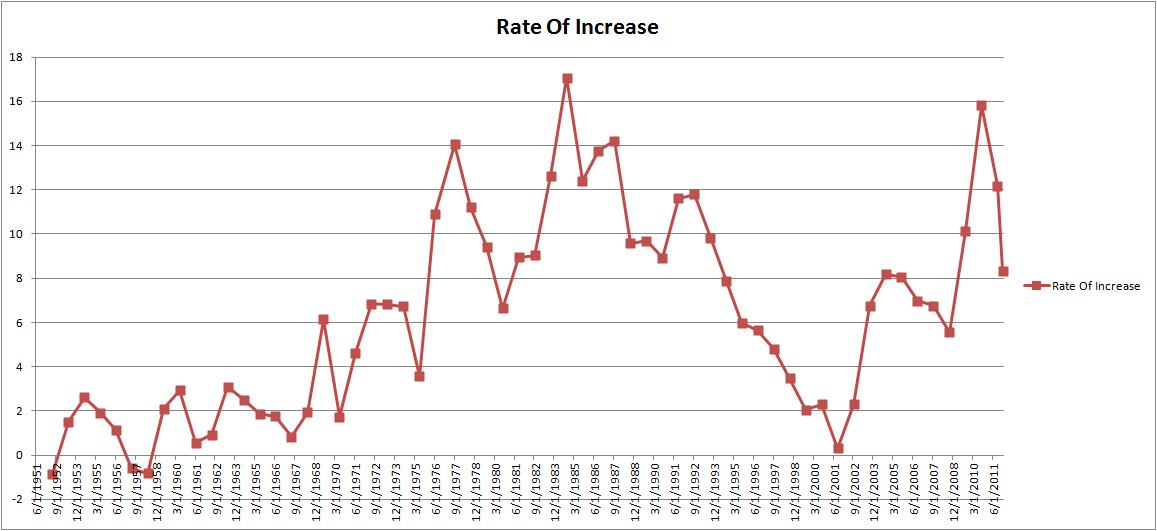
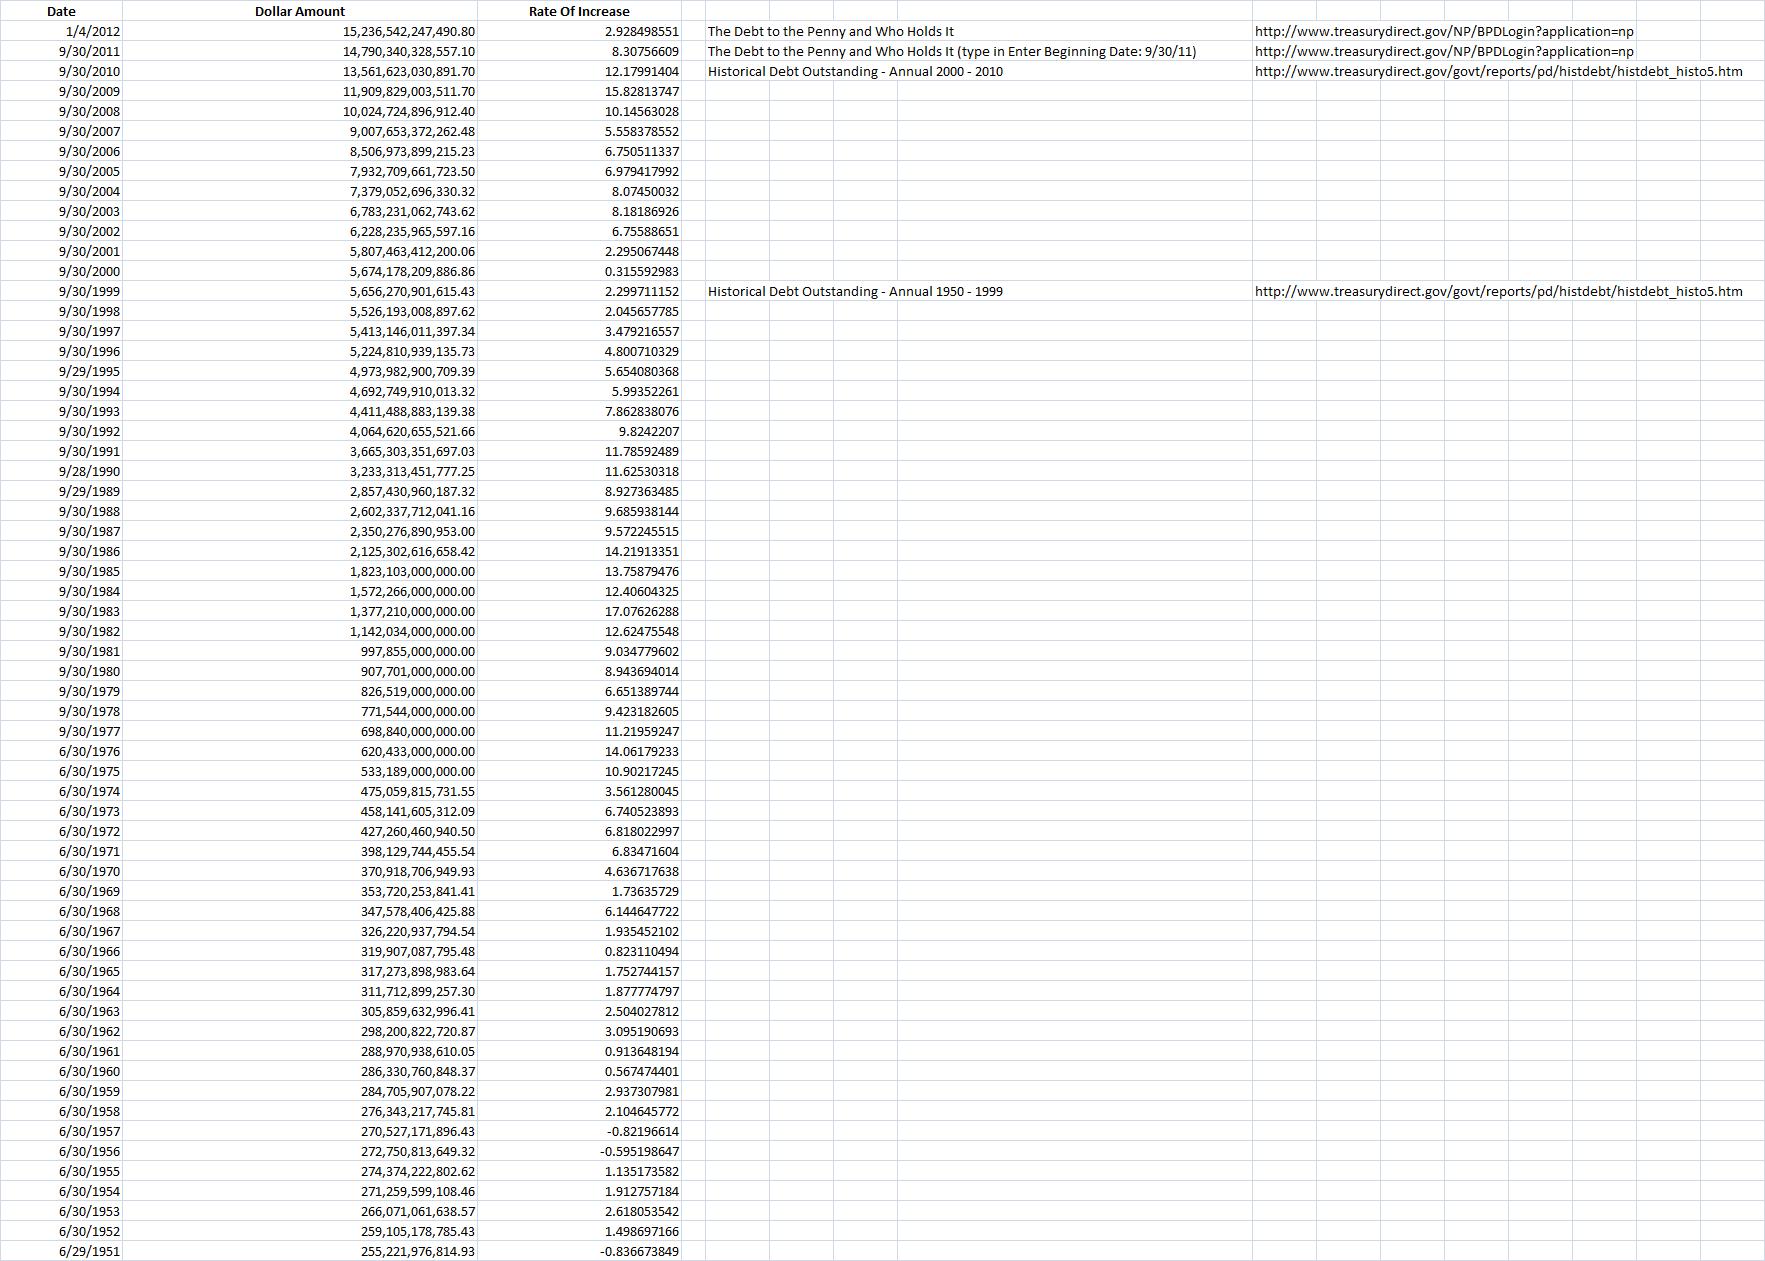
This following data comes from this (xls) Office of Management and Budget (OMB) source:

I re-plotted the data since, you could say, I have trust issues on the internet. It is similar to the data in the post.

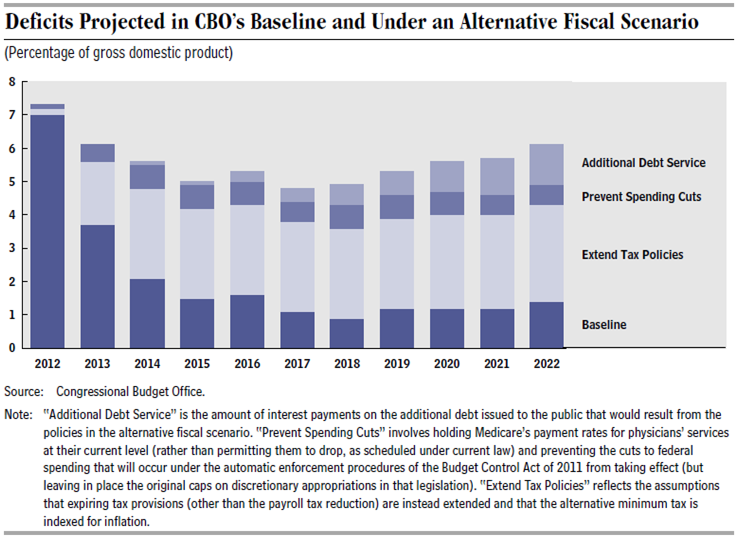
The following is “The Budget and Economic Outlook: Fiscal Years 2012 to 2022” from the Congressional Budget Office.

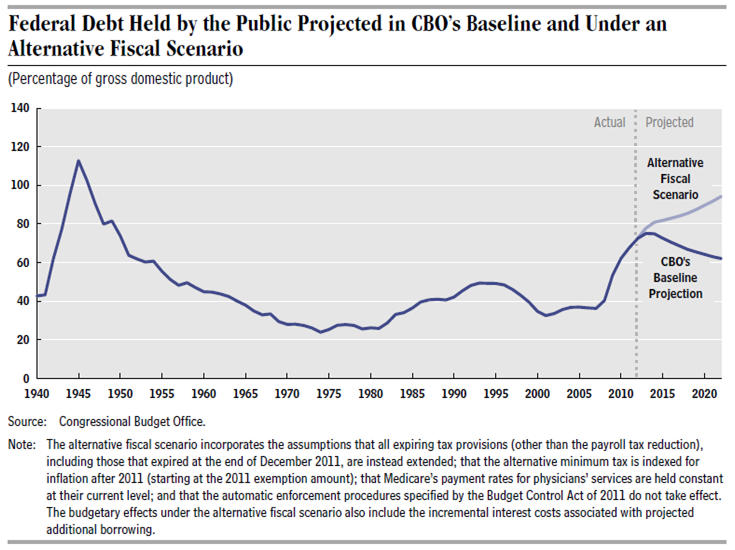
What the blog post above did not state is that the historical years since the Bush tax cuts and the recession that started prior to President Obama taking office, have been the major contributors to the rise in spending as a percentage of GDP. Also, the future years the OMB graph shows is a worst case scenario that includes the CBO Alternative Fiscal Scenario which assumes the Bush tax cuts are extended. President Obama did not create the recession, he inherited it. The Bush tax cuts were not enacted into law by President Obama. It is a lie to blame the recession and the Bush tax cuts on President Obama.

Let’s dig down a little more.

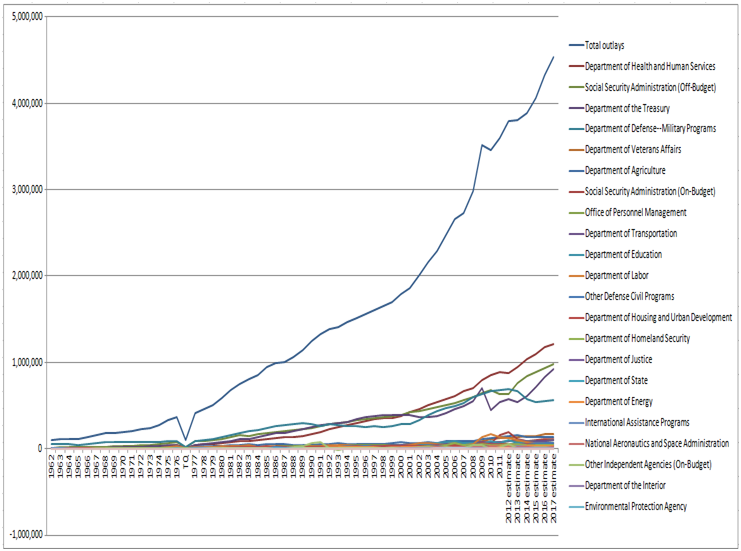
This following is historical and projected outlays from The Office and Management Budget by agency. Outlays are the total amount of money spent including authority from prior years that obligates outlays in the current year. The source data from the following charts comes from this (xls) OMB data. The data lines and the legend descriptions are in the same order. My graphics file can be downloaded here (xls). This chart shows that the Federal debt has accumulated from previous years going back to 1962.

OUTLAYS BY AGENCY: 1962–2017

(in millions of dollars)


This chart shows that the Federal debt has accumulated from previous years going back to 2000.

OUTLAYS BY AGENCY: 2000–2017

(in millions of dollars)

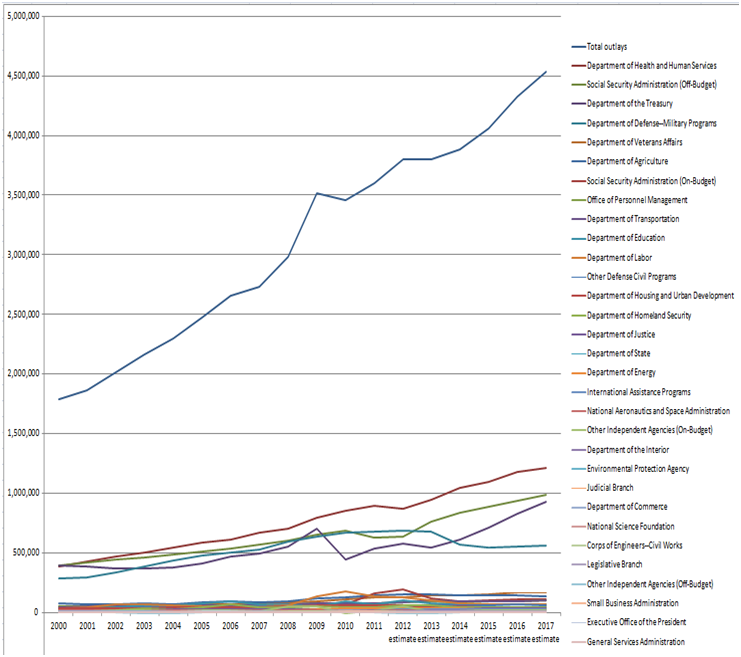
There is no huge increase in spending starting in 2009 when President Obama was inaugurated. The estimates include the Affordable Care Act. The chart shows that all the major increases in spending started ramping up more quickly in the decade of 2000. The spending is chiefly in the Department of Health and Human Services, Social Security Administration (off-budget), Department of Treasury and the Department of Defense (Military Programs). The Department of Health and Human Services increase comes chiefly from the middle class falling closer towards the federal poverty level as discussed below in more detail. The Social Security Administration increases have to do with baby boomers getting older and rising health care costs. The Treasury Department increases come basically from paying interest on the national debt by financing it with government bonds. The Department of Defense increases have to do with the wars in Iraq and Afghanistan and the costs of gearing up for war. It is interesting to note that the U.S. spends 41% of the world’s total military expenditure. China, the next highest in the world’s total military expenditure, only spends 8.2% (see this).

The baseline scenario in the graph below shows current law and the effect of continuing certain programs that are scheduled to expire.


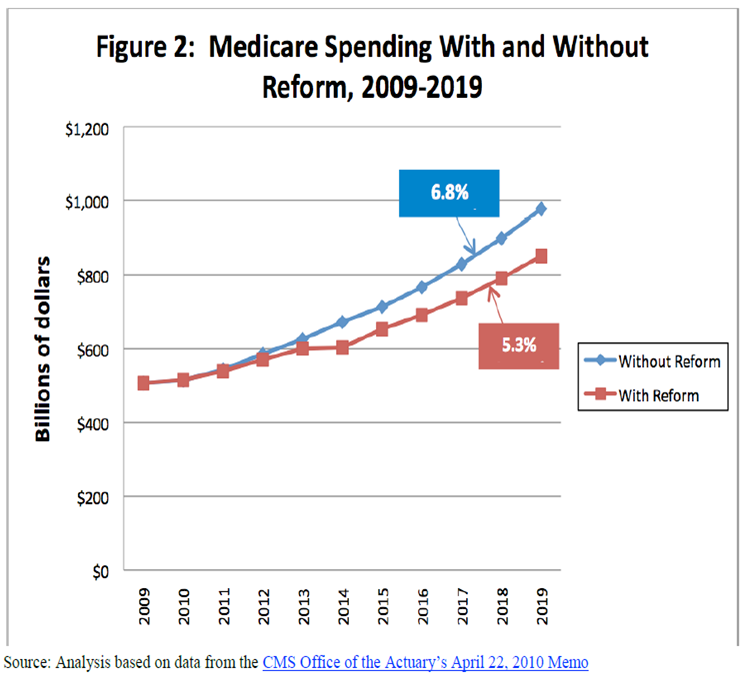
If you really want to raise the debt go ahead and repeal the Affordable Care Act according to the Center for Medicare and Medicaid Service (CMS) according to this publication:


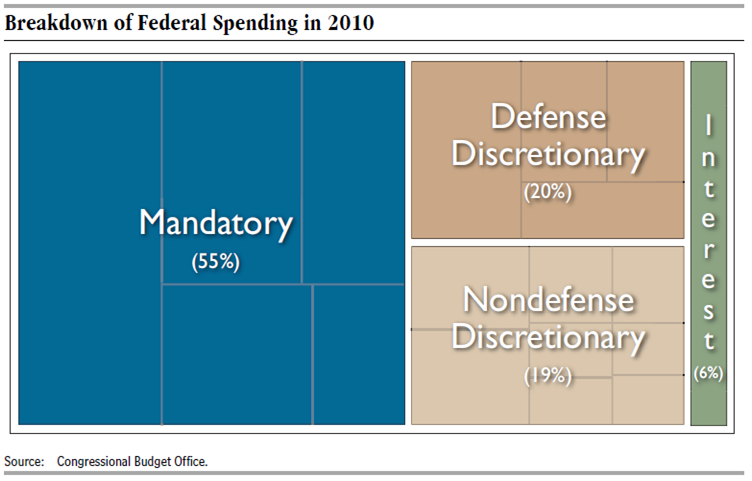
Mandatory budget items are not optional year to year. It takes an act of Congress to change a mandated budget item. These requirements were made by Republicans and Democrats over the years. President Obama did not create the vast majority of mandatory budget requirements. The Affordable Care Act is mandatory but as already shown will lower the debt unless it is repealed. Discretionary budget items are voted on each year by Congress in 13 appropriations bills. Here is a chart showing mandatory and discretionary spending for 2010:

Mandatory and discretionary budget items are further explained in this:

Discretionary spending is provided in, and controlled by, annual appropriations acts, which fund many of the routine activities commonly associated with such federal government functions as running executive branch agencies, congressional offices and agencies, and international operations of the government.1 Essentially all spending on federal wages and salaries is discretionary.

Discretionary spending is often contrasted with mandatory, or direct, spending. Mandatory spending includes federal spending on entitlement programs, the Supplemental Nutrition Assistance Program (formerly known as the Food Stamps program), and other spending controlled by laws other than appropriation acts.3 Spending levels for mandatory programs are generally controlled by eligibility criteria and size of the eligible population.


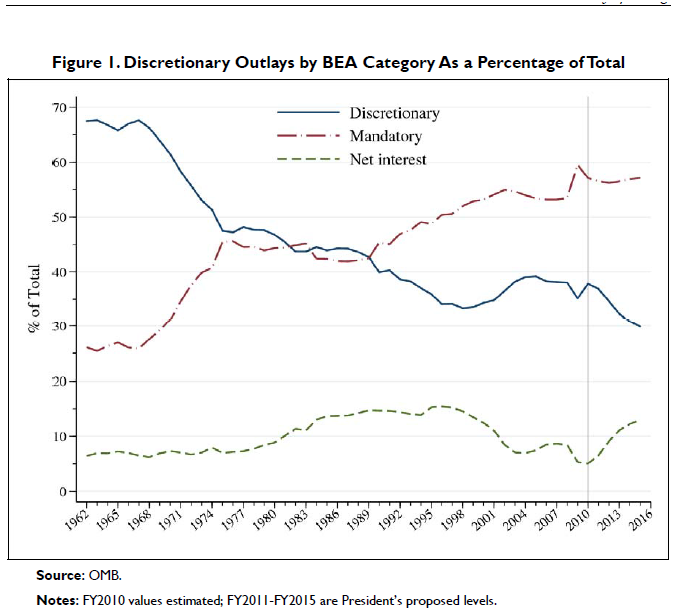
Mandatory budget items have gone up for some time now as this chart shows:


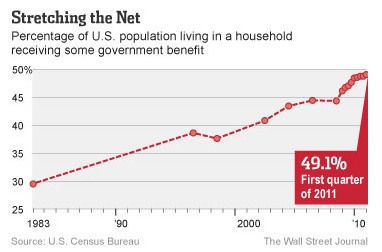
The recession which certainly preceded President Obama has resulted in many more people qualifying for entitlement benefits. President Obama did not change qualification requirements for these programs. As more people fell towards the federal poverty level, more people have received government benefits. This is shown by the Census Bureau and an article in the Wall Street Journal:


All of this data supports the conclusion that President Obama has acted very responsibly in view of the economic catastrophe he inherited. The far right is spinning yet another myth.

Links for further reading:

http://blogs.wsj.com/economics/2012/05/26/number-of-the-week-half-of-u-s-lives-in-household-getting-benefits/

http://useconomy.about.com/od/fiscalpolicy/p/Mandatory.htm

http://useconomy.about.com/od/fiscalpolicy/tp/US_Federal_Budget.htm

http://www.whitehouse.gov/omb/budget/historicals/

http://useconomy.about.com/od/healthcarereform/f/Patient-Affordable-Care-Act.htm

http://useconomy.about.com/od/candidatesandtheeconomy/f/Healthcare_Reform_and_Budget.htm

http://super-economy.blogspot.com.au/2011/08/obama-hockey-stick.html

http://super-economy.blogspot.com.au/2011/12/american-federal-debt.html

http://www.cbo.gov/publication/21203

http://www.washingtonpost.com/business/economy/adding-to-the-deficit-bush-vs-obama/2012/01/31/gIQAQ0kFgQ_graphic.html

http://www.cbpp.org/research/index.cfm?fa=topic&id=121

http://www.gao.gov/special.pubs/longterm/pdfs/spring2012_update_slides.pdf

http://www.cbo.gov/sites/default/files/cbofiles/ftpdocs/108xx/doc10871/01-26-outlook.pdf

http://www.nytimes.com/packages/html/newsgraphics/2011/0119-budget/index.html

http://www.kaiserhealthnews.org/Stories/2011/February/14/President-Obama-Proposed-HHS-Budget-2012.aspx

http://www.whitehouse.gov/sites/default/files/omb/budget/fy2012/assets/health.pdf

http://www.cms.gov/Research-Statistics-Data-and-Systems/Research/ActuarialStudies/downloads/HR3200_2009-10-21.pdf

http://www.cbpp.org/cms/index.cfm?fa=view&id=3450

http://www.cbp.org/documents/120224_CalWORKs_KeyFacts.pdf

http://www.nytimes.com/2012/04/08/us/welfare-limits-left-poor-adrift-as-recession-hit.html?pagewanted=all

http://www.kff.org/medicaid/upload/7985.pdf

http://www.ssa.gov/history/BudgetTreatment.html

http://www.epi.org/publication/bp156/

http://www.socialsecurity.gov/history/InternetMyths.html

http://www.nytimes.com/2009/05/13/us/politics/13health.html

http://www.usgovernmentspending.com/year_spending_2012USbn_13bs1n_3031#usgs302

http://www.globalissues.org/article/75/world-military-spending

Down the Rabbit Hole

Rather often I feel like listening to the Republicans is like living in Alice’s wonderland. Here are some examples:

Who created more debt Bush or Obama?

The opiate truth: Obama increased the national debt vastly more than any other president.

The non-opiate truth:

The Graph – Center on Budget and Policy Priorities is non-partisan.

Here are the latest absolute numbers on the debt increase between President Bush and President Obama:

Bush debt increase: 85%

Obama debt increase: 44%

From January 20, 2001 to January 20, 2009 the national debt increased from $5,727,776,738,304.64 to $10,626,877,048,913.08. For those that still believe in arithmetic this is an 85% increase in the debt over the Bush administration’s term ((10,626,877,048,913.08 / 5,727,776,738,304.64) * 100) = 185% or an 85% increase).

From January 20, 2009 to February 3, 2012 the national debt increased from $10,626,877,048,913.08 to $15,330,778,119,850.60. This is a 44% increase in debt over President Obama’s term ((15,330,778,119,850.60 / 10,626,877,048,913.08) * 100) = 143% or a 43% increase).

Don’t take my word for it, check it out on the US Treasury Department site.

Additionally, there is the discretionary and non-discretionary part of the budget. Discretionary spending is annual spending that the congress and the president have to deal with every year; non-discretionary is mandatory, multiyear spending that has already been committed to by previous administrations (i.e., like food stamps calculated to poverty levels). The non-discretionary portion of the 2011 budget is 59%; the discretionary is 34% (reference).

What Republicans call Obama-Care has not kicked in yet but the GAO wrote a report that I have read from start to finish that claims it will take 100 billion off the budget over 10 years as compared to doing nothing (can’t cherry pick GAO reports in my opinion – ask my wife – she retired from the GAO). However, the 1 trillion dollars over 10 years of Medicare Part D that was passed by a Republican president (Bush) and Republican dominated House and Senate has already started to hit non-discretionary spending. The non-discretionary part of the budget makes up the lion’s share of the increased debt spending that you see at the end of the Bush administration. Part is this has to do with the wars, the national disasters (FEMA) and more importantly the recession. As more people go into poverty entitlements that were all previously linked to poverty numbers kick in with much higher amounts of spending – nothing to do with President Obama. This will be discussed more later in this essay.

Who created more unemployment Bush or Obama?

The opiate truth: Obama increased unemployment vastly more than any other president.

The non-opiate truth:

Bush increase in unemployment: 86%

Obama increase in unemployment: 6%

When Bush took office on January 20, 2001, the national unemployment rate was 4.2%. When he left office on January 20, 2009 and President Obama took office the national unemployment rate was 7.8%

The current unemployment rate as of January 6, 2012 is 8.3%

Doing the math, the increase during the Bush administration was (7.8 / 4.2) * 100 = 186% or a 86% increase in unemployment. For the Obama administration the math is (8.3 / 7.8) * 100 = 106% or a 6% increase in unemployment.

* Note: I have revised this based the January, 2009 unemployment number of 7.8%. President Obama took office January, 20, 2009. From the graph below you can see that the unemployment rate exploded just as he got into office. I think this explosion arguably was not due to anything President Obama did in his first few months (just 4 months later the rate was 9.4%) as the national unemployment rate does not turn on the dime but I will give the detractors the benefit of the doubt. There is still a huge difference in 86% (Bush) and 6% (Obama). If the numbers from 4 months after President Obama took office are used they work out to:

Bush administration increase in unemployment: 124%

Obama administration decrease in unemployment: 12%

Transition Date: End of May, 2009

Given this, the difference would be a 136% increase in unemployment during the Bush administration over the Obama administration.


Reference

How do Americans feel about abortion?

The opiate truth: The majority of Americans are against abortion.

The non-opiate truth:

Entitlement programs?

The opiate truth: Entitlement programs do not do anything but waste taxpayers money.

The non-opiate truth:

President Obama and food stamps?

The opiate truth: President Obama is the ‘food stamp president’.

The non-opiate truth:

Food stamps have been tied to poverty levels for decades. President Obama has nothing to do with the automatic levels that kicked in due to the recession that started in the Bush administration.

Additionally, many of the entitlement programs are tied by law to the poverty line and/or adjusted income.

Introduction to the Supplemental Security Income (SSI) Program

Interesting chart…

Even with all the additional expenses of non-discretionary entitlement programs kicking in during the Obama administration, the rate of increase of the national debt is still less that the Bush administration.

This is a graph of the debt since 1950 (click on the graphs to make them larger)…


This is the rate of increase of the debt since 1950…


Please note the difference from 2001 to 2009 and 2009 to 2011. This is Bush vs Obama

Note: The graph only uses full fiscal year data. The last fiscal year ended was September 30, 2011

Here is the data and links to the Treasury Department to verify the numbers…


The links shown above are:
Historical Debt Outstanding – Annual 2000 – 2010
Historical Debt Outstanding – Annual 1950 – 1999
The Debt to the Penny and Who Holds It
Debt Position and Activity Report
The Debt to the Penny and Who Holds It (type in Enter Beginning Date: 9/30/11)

Please, don’t vote and do drugs!

Federal Deficit and Debt – President Obama vs President Bush

If you look at these numbers you will see that the national debt has gone up every year since 1969 except the last four years of the Clinton administration budget:

Revenues, Outlays, Deficits, Surpluses, and Debt Held by the Public,

1968 to 2007, in Billions of Dollars

Sources: Congressional Budget Office; Office of Management and Budget.

Date         Deficit (-) or Surplus Debt Held by the Public

1968                 -25.2                             289.5

1969                 3.2                                278.1

1970                 -2.8                               283.2

1971                 -23.0                             303.0

1972                 -23.4                             322.4

1973                 -14.9                             340.9

1974                 -6.1                               343.7

1975                 -53.2                             394.7

1976                 -73.7                             477.4

1977                 -53.7                             549.1

1978                 -59.2                             607.1

1979                 -40.7                             640.3

1980                 -73.8                             711.9

1981                 -79.0                             789.4

1982                 -128.0                           924.6

1983                 -207.8                           1,137.3

1984                 -185.4                           1,307.0

1985                 -212.3                           1,507.3

1986                 -221.2                           1,740.6

1987                 -149.7                           1,889.8

1988                 -155.2                           2,051.6

1989                 -152.6                           2,190.7

1990                 -221.0                           2,411.6

1991                 -269.2                           2,689.0

1992                 -290.3                           2,999.7

1993                 -255.1                           3,248.4

1994                 -203.2                           3,433.1

1995                 -164.0                           3,604.4

1996                 -107.4                           3,734.1

1997                 -21.9                             3,772.3

1998                 69.3                              3,721.1

1999                 125.6                            3,632.4

2000                 236.2                            3,409.8

2001                 128.2                            3,319.6

2002                 -157.8                           3,540.4

2003                 -377.6                           3,913.4

2004                 -412.7                           4,295.5

2005                 -318.3                           4,592.2

2006                 -248.2                           4,829.0

2007                 -160.7                           5,035.1

http://www.cbo.gov/budget/data/historical.pdf

Federal Debt Under President George W. Bush

President Bush started with 3.3196 trillion dollars of public debt.

He left his 8 years (6 years with control of both branches of Congress) with 7.8111 trillion dollars of public debt.

This means the public debt increased 4.4915 trillion dollars during his administration.

Federal Debt Under President Obama

Here are the numbers for the Obama administration projected out to 21014:

Year Gross Debt in Billions as % of GDP Debt Held By Public ($Billions) as % of GDP
2010 (2 Sept) 13,442.1 92.1 (2nd Q) 8,933.2 61.2 (2nd Q)
2010 (est.) 14,456.3 98.1 9,881.9 67.1
2011 (est.) 15,673.9 101.0 10,873.1 70.1
2012 (est.) 16,565.7 100.6 11,468.4 69.6
2013 (est.) 17,440.2 99.7 12,027.1 68.7
2014 (est.) 18,350.0 99.8 12,594.8 68.5

 This means the public debt is estimated to increase under the Obama administration by 4.7837 trillion dollars.

http://en.wikipedia.org/wiki/United_States_public_debt

Wikipedia can be unreliable but I checked out the numbers before I posted the link.  The chart is a little simpler to read but here is the official US Treasury Department numbers:

http://www.treasurydirect.gov/govt/reports/pd/histdebt/histdebt_histo4.htm

http://www.treasurydirect.gov/govt/reports/pd/histdebt/histdebt_histo5.htm

Projected (est.) Congressional Budget Office numbers come from this report:

http://www.cbo.gov/ftpdocs/100xx/doc10014/03-20-PresidentBudget.pdf

Republican’s commonly complain that the surplus was due to Republican control of the Congress.  However, they do not point out that President Clinton did not have full control of the Congress for six years as President Bush did.

The Republicans took control (not a super majority) of the US House of Representatives in 1994 not the Senate.

http://en.wikipedia.org/wiki/United_States_House_of_Representatives_elections,_1994

In 1995 the Republicans took control of the Senate as well (not a super majority).

“In the 1996, 1998, and 2000 elections, Republicans lost Congressional seats but still retained control of the House and, more narrowly, the Senate. After the 2000 election, the Senate was divided evenly between the parties, with Republicans retaining the right to organize the Senate due to the election of Dick Cheney as Vice President and ex officio presiding officer of the Senate. The Senate shifted to control by the Democrats (though they technically were the plurality party as they were one short of a majority) after GOP senator Jim Jeffords changed party registration to “Independent” in June 2001, but later returned to Republican control after the November 2002 elections. In the 2006 elections, Democrats won both the House of Representatives (233 Democrats, 202 Republicans) and the Senate (49 Democrats, 49 Republicans, and 2 Independents caucusing with the Democrats) as well as the majority of state governorships (28-22).”

http://en.wikipedia.org/wiki/Republican_Revolution

The Republicans had full control of the Executive and Congressional branches of government for six years and could not generate a surplus.  However, President Clinton did it for four years without having full control.

Unemployment Statistics – President Obama vs President Bush


Unemployment Under President George W. Bush

The unemployment rate in 2000 was 4.0%

The unemployment rate in 2009 was 9.3%

The rate went from 4.0% to 7.7% under President Bush, 3.7% over his administration.

http://www.bls.gov/cps/cpsaat1.pdf

Unemployment Under President Obama

Current estimates are 9.6%

President Obama took office on January 20, 2009

In January 2009 the rate was 7.7%

It went from 7.7% to estimated 9.6% under President Obama, 1.9% under President Obama to date.

Series Id:           LNS14000000
Seasonally Adjusted
Series title:        (Seas) Unemployment Rate
Labor force status:  Unemployment rate
Type of data:        Percent or rate
Age:                 16 years and over

Top of Form

Download:

Bottom of Form

Year Jan Feb Mar Apr May Jun Jul Aug Sep Oct Nov Dec Annual
2000 4.0 4.1 4.0 3.8 4.0 4.0 4.0 4.1 3.9 3.9 3.9 3.9  
2001 4.2 4.2 4.3 4.4 4.3 4.5 4.6 4.9 5.0 5.3 5.5 5.7  
2002 5.7 5.7 5.7 5.9 5.8 5.8 5.8 5.7 5.7 5.7 5.9 6.0  
2003 5.8 5.9 5.9 6.0 6.1 6.3 6.2 6.1 6.1 6.0 5.8 5.7  
2004 5.7 5.6 5.8 5.6 5.6 5.6 5.5 5.4 5.4 5.5 5.4 5.4  
2005 5.3 5.4 5.2 5.2 5.1 5.0 5.0 4.9 5.0 5.0 5.0 4.9  
2006 4.7 4.8 4.7 4.7 4.6 4.6 4.7 4.7 4.5 4.4 4.5 4.4  
2007 4.6 4.5 4.4 4.5 4.4 4.6 4.6 4.6 4.7 4.7 4.7 5.0  
2008 5.0 4.8 5.1 5.0 5.4 5.5 5.8 6.1 6.2 6.6 6.9 7.4  
2009 7.7 8.2 8.6 8.9 9.4 9.5 9.4 9.7 9.8 10.1 10.0 10.0  
2010 9.7 9.7 9.7 9.9 9.7 9.5 9.5 9.6 9.6        

http://www.bls.gov/webapps/legacy/cpsatab15.htm (need check U3 Seasonally Adjusted)

The Absolute Necessity of Rhetoric

In President Obama’s recent trip to Afghanistan he told the troops that he would not send troops anywhere that was not “absolutely necessary” (http://frontpagemag.com/2009/10/27/mission-abandoned-%e2%80%93-by-alan-w-dowd/).  When President Bush started the war in Afghanistan he justified it as a crusade, vengeance for 911, a Texas style hanging for Al-Qaida and killing the ones responsible for 911.  I never heard him state that he was going to bring the terrorists responsible for 911 to justice.  He may have made that statement but most of the statements were along the line previously described.  Using these rhetorical ploys Bush was able to get the support he needed to start the war in Afghanistan.  Hatred is always a strong emotion while justice is emotionally a bit puny.  Bush started the war against Afghanistan based on rhetoric about getting Al-Qaida.  To date Al-Qaida is still around and our rhetoric about our enemy Al-Qaida is also used freely about the Taliban.  While no one would suggest that the Taliban is a great group of guys, they were not the stated reason why we went to war in Afghanistan.  Fanning the flames of 911, Bush was able to start a war.  His rhetoric became President Obama’s “absolute necessity”. 

I have previously stated that as leader of the United States, President Bush should have stated that we would bring Al-Qaida to justice.  Preferably, this would be done through the United Nations, the World Court and pressure from the World Monetary Fund (in Afghanistan and Pakistan).  President Bush’s rhetoric should have made justice the guiding principle.  We would have kept the sympathies of the world and made justice the value that everyone, no matter what their political persuasion, sympathetic to the universality of justice.  Vengeance and hatred on the other hand are regionally specific.  Those that hate and want vengeance are driven by their own internal necessity not by any universal appeal, by an ideal that everyone could think is worthwhile.  As I have also mentioned in another paper, barring the earnest attempt to get justice in a region of the world where justice is highly lacking, the alternative would be US Special Forces, the CIA, mercenaries, and covert bribes and pressure.  Don’t think it can’t be done; we had a whole cold war based in Afghanistan against the Russians using these techniques many years ago.  However, the political rhetoric should always be concentrated on universal values not regional and circumstantial emotions.

When our hatred drives our rhetoric the rhetoric can take on a life of its own in popular culture.  The switch from admirable, universal ideals to self-aggrandizing, raw and base instincts that become yet another mindless iteration of the past; it becomes its own necessity.  The necessity driven by hatred always ends badly.  The necessity driven by high ideals, historically always ends well.  Examples of the latter include the founding fathers, Gandhi, Martin Luther King Jr., Jesus, etc.  Unfortunately, the earlier is typically the blunder of humankind.

Since rhetoric based in base instinct got us into Afghanistan, I think President Obama had no other choice but to use rhetoric to get us out of Afghanistan.  It has been done before (Vietnam comes to mind) – we declare victory for x, y, z reasons and get the hell out.  We pursue the cause of bringing Al-Qaida to justice using the previously discussed strategies.  As it is, now we are looking at an endless war that has the tendency to expand as these situations typically do.

Another example of rhetoric gone badly is the recent militant rhetoric used by the Republican Party against the Democrats.  The Republican leaders play on the strong emotions of hatred and violence with inflammatory rhetoric and “wash their hands” of it when their words start taking a life of its own in popular behavior.  If you want to understand how Hitler was able to do what he did you can see the beginnings of it in these kinds of rhetorical ploys. 

While personally, I have never opposed capital punishment in cases where there is “no shadow of doubt” about the defendant’s guilt, I have opposed it based on the rhetorical dynamic described above.  When the necessity of rhetoric is allowed to run rampant Texas style executions become more and more “normal” and statistics about wrongful deaths and ethnic inequalities of the death penalty become more and more prevalent.

President Obama should have held to his higher ideals and not adopted the rhetorical necessity handed to him by the Bush administration. 

On a more philosophical level, the dynamic of rhetorical necessity tells us something about human’s unique way of being-in-the-world.  Our narratives of history become our cannon.  The ill-conceived actions that typically follow continue to create generations of veterans and Republican voters that sanctify our motivations and our histories.  The perceived alternative would be to exist in meaninglessness.  God, the self-evident and the a priori surround us as witnesses to our ultimate worthiness and meaning.  In the margins of our hubris plays the alter-ego, the lie of truth and the future seeds of our own undoing.

All War is Evil

In this case, evil is not meant in the sense of religious evil or theistic evil but in a humanitarian sense.   Religion and God(s) have always found a way to justify war.  War is evil because it is not a zero sum game.  Only those that have emotional distance from war can treat it like a zero sum game.  Distance allows folks to fashion a marketing campaign to justify war.  Death affords no distance.  The life of the innocent child killed in war is never brought back to life.  The family lives in the hollow catacombs of their child’s death until they die.  The tragedy can’t be made right; it is absolutely irrecoverable and irrevocable.  Women, children, the old, friendly fire, collateral damage is not a number that is offset by the `would have’ number, the number that `would have’ died without the war.  There is no erasure of tragedy for those that have lost loved ones.  There is only the empty void where a life used to be.  There is no just war; only a necessary war.  The marketing of a just war is a huge rationalization for evil.  Only those devoid of the emotional impact of war can deem it glorious.  The tragic loss of a loved one to war is organic.  No amount of words can overcome the inert downward pull of that pit.  Only ignorance and emotive indifference can once again renew the call to fight the glorious battle.  Was Iraq and Afghanistan necessary?  Was our country going to be over-thrown by these thugs?  No.  Did we suffer tragic loss in 911?  Yes.  Will our killing rampages in the world change our tragic loss?  No.  We tell ourselves by cleverly crafted tomes that we will prevent more loss of life by our action and thus, justify our wars.  By killing others we create a `greater good’.  What is that `greater good’ in the case of Iraq and Afghanistan?  We have created many more enemies all over the world and given Al Qaeda a recruitment bonanza.  Even our old friends have more ambivalent or even negative relations with us now.  We killed more of our young people now than were killed in 911.  We killed hundreds of thousands of non-enemy combatants (babies and kids to start with).  All the discussion of a `just war’ does not offset or equalize the tragic loss of one child.  It only provides an easy escape for those that would perpetuate this tragic loss.  If you perpetuate war you are as guilty as if you pulled the trigger on the baby.  You can tell yourself otherwise but your justice rings hollow.  In the ears of tragedy, your defiance to allow the full weight of your rationalization to indict your personal responsibility is absolutely detestable.  Your good has become evil, a humanitarian evil.  You have become part of the problem not the solution and the more you deny and justify, the more you create the problem once again.  War is a black tar baby that every generation has resolved to leave behind only to re-entangle us again.  We create a new generation of patriots and a new generation of patriot haters.  Go ahead, hold your ears and scream of my evil intentions but evil begets evil and graves only cry for more graves.  Until you live with the gravity of your ideas on a daily basis you have yet to live in the reality of tragedy.  Don’t tell those of us who live that on a daily basis that justice has anything to do with erasing our loss.  Don’t tell us your virtuous intentions give us emotional buoyancy or offset our organic reality.  You only soil yourself in our view.  Go ahead gather your warmonger friends and have your death parties all over the world but no one can silence the hellish voice that you perpetually resurrect in your violent zeal.  Peace does not come from war, only death and tragedy.  Perhaps evil is necessary in extreme times but no one should take any pride or glory in evil unless one is evil.