UPDATE: I have updated this previous post to enhance the clarity of the graphs, make the state’s political party domination reflect the time period of the Census data (from 2014 instead of the 2016) and to correct the food stamps data error for Wyoming (I found the data point to be that of Puerto Rico). I will also make the Excel Spreadsheet available to download here. Additionally, I will do some more statistical analysis in the future on this data in order to spell out some more conclusions that I think we could draw from the data.
Just let me say that the whole point of social programs is to help people, that are able, get out of poverty not stay in it perpetually. Success or failure should be measured by non-partisan statistics. I think the Census Bureau qualifies as non-partisan. The continual insistence the Republican Party has made over decades to get rid of, or greatly reduce, social programs can be shown to result in perpetual and greater poverty in terms of human misery. To the contrary, their insistence that the free market will go further in solving these problems than government assistance has not shown up in the data. How many more decades and excuses will it take before they face facts and not unfounded aspirations? Naysaying never solves problems; it only ignores problems.
In a recent post, The End of the Republican Party, I made a comment about decades of Republican political domination in the Deep South and the high poverty rate and low standard of living. In older posts I have referenced this data but I would like to supplement this data with 2014 data from the U.S. Census Bureau1 I also referred to an opinion post in Forbes online by Mark Hendrickson defending the Republicans shabby history of governing these states in which he largely blamed the Civil War and Democrats for these conditions.2 The facts are that Republicans have dominated the Deep South for many decades and those states are the worse off for it. If decades are not enough time to justify their failed economics the question looms as to how long they need to justify their boisterous and voluminous claims. In the meantime, countless people suffer and die waiting for an economic rapture that gets further and further from reality and hard facts. Their latest non-democratic ‘brilliant’ idea about emergency management in Flint Michigan poisoned and damaged the kids they claim to be so ‘pro-life’ about for their entire life. However, that is a topic for another day.
Below are charts compiled from the Census Bureau. I can provide the Excel Spreadsheets in anyone is interested in more detailed data. The charts detail 2014 data for all the states in the U.S. on the following topics:
Percentage of families below the poverty line
Percentage of families on public assistance
Percentage of families on food stamps
Percentage of families with no health insurance
I have sorted the data by states from worst result to best results. I also obtained each states political affiliations for Governor and state legislative bodies.3 The color codes on the sides and tops of the charts indicate the following for 2016 political offices:
Red – The Governor and legislature have Republican majorities
Orange – The Governor and legislature lean Republican
Blue – The Governor and legislature lean Democratic
Dark Blue – The Governor and legislature have Democratic majorities
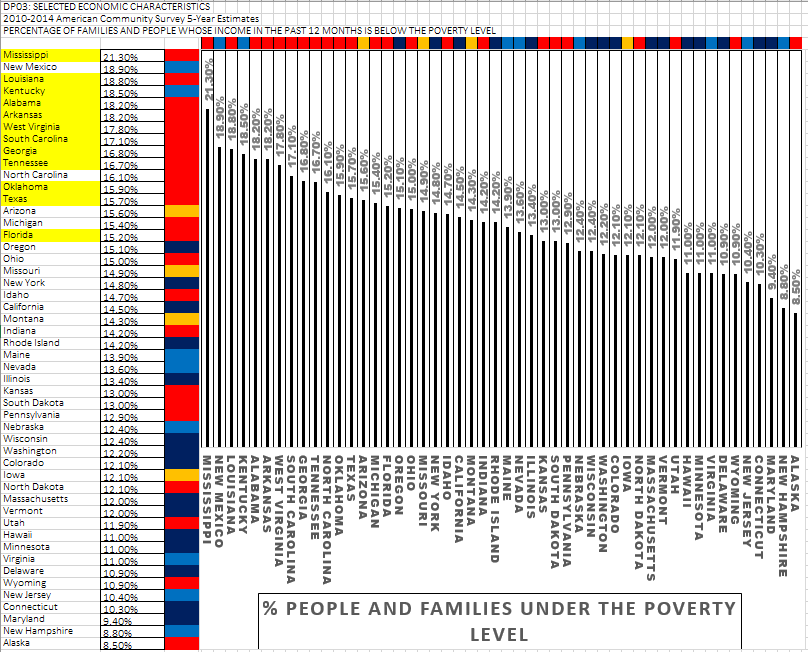
The chart below shows the data widely reported concerning the percentage of families living below the poverty line, concentrated largely in Southern States. I have highlighted Southern States in yellow. Mississippi heads the list with over 21% of families living below $24,300 for a family of four. Louisiana, Alabama, Kentucky, Georgia, Texas, Tennessee, Arizona and Florida are all in the hardest hit states. All these states have been dominated by Republican economics for decades. It is interesting that Louisiana recently elected a Democratic Governor after two terms of Republican Bobby Jindal (not reflected in the 2014 data).
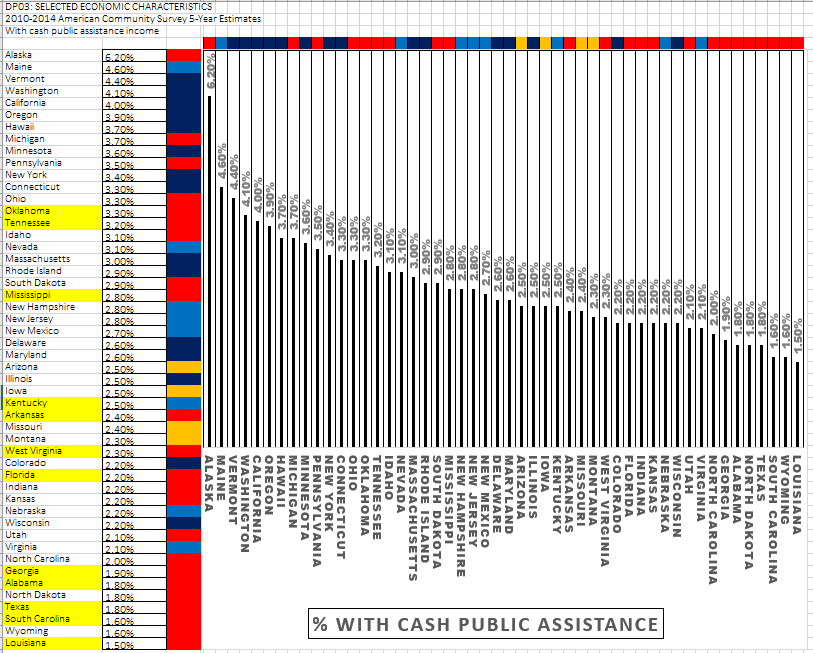
The chart below shows the percentage of families with the most to the least cash public assistance income. It is really fascinating that this chart seems to be almost inverted from the previous chart. The least public assistance to the poor and children goes again to the poorest Southern States. This probably has a lot to do with the sheer volume of people living below the poverty line in those states. It also has to do with the dollar amount the states have to contribute to administer some of these programs. Republicans are all too happy to pat themselves on the back for not giving ‘hand outs’ to the poor but the data tells us that instead of solving their poverty problems their ideology simply perpetuates the misery of their citizens. While Republicans may go to church every Sunday prideful of their staunch economic policies to help the poor, the data tells us that their effect is the opposite from the admonitions of Jesus to care about the poor.
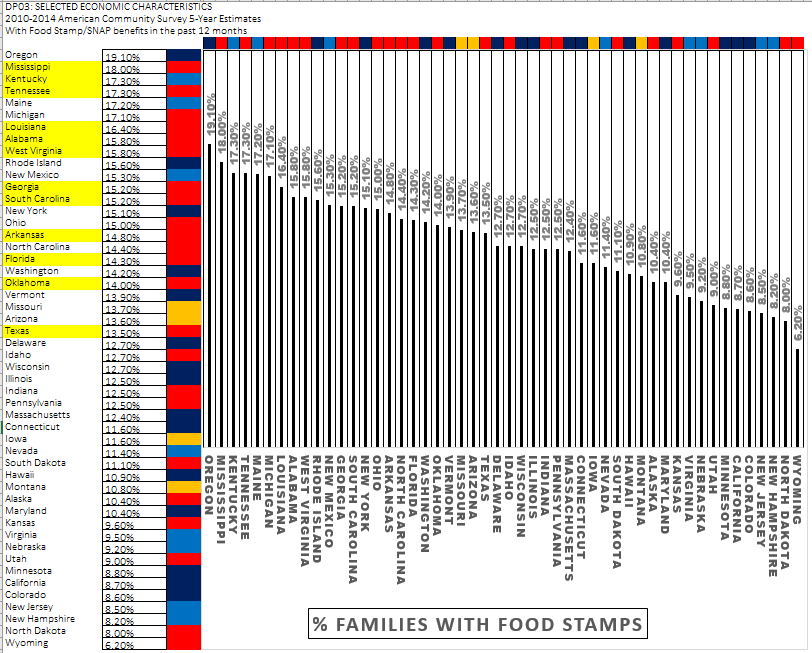
With regard to the SNAP program for food stamps, the data show the Southern States once again come in at the highest percentages of Federal food stamps.
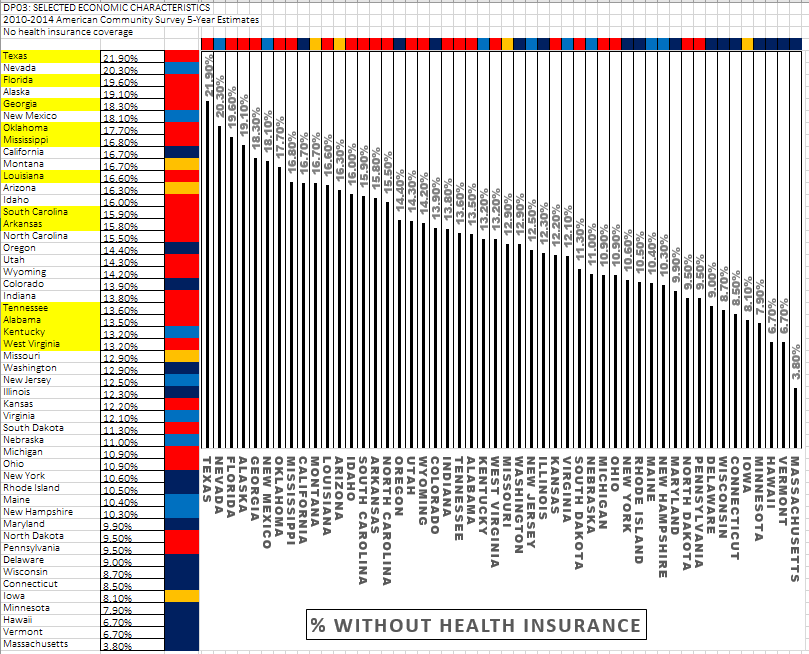
Once again the Southern States have the highest percentages in people without health insurance. This probably has to do with many of their refusal to participate in the Medicaid expansion brought on by their intense hatred of any Obama at the human cost of their own citizenry.
Real data shows the Republican economics has not worked in the states hardest hit by Republican ideologies.4 Their adamant refusal to face the hard cold facts and continue to insist that they know how to handle the economy is spite of the suffering of the poorest states they have dominated for decades highly suggests a more dubious purpose for their rhetoric: their concern has nothing to do with achieving real results for the less fortunate but has more to do with protecting a more narrow constituency than most of their base cares to believe. Their strategy is a protectionist tactic for those with vested interests in less honorable goals while their marketing propaganda is obsessed with playing on people’s reactionary emotions and rarely realized aspirations.
To conclude, let me state that the huge divide between results in Democratic and Republican states makes me re-think the 10th Amendment’s emphasis on state’s rights. I know this is a huge emphasis for the Republican Party but maybe Democrats could benefit from more separation with the states. If the divide between Republican dominated economics and Democrat dominated economics became large enough for most people to see the practical effects of each strain of economic and political ideologies, the ability to blame the other party might be reduced enough for most folks to see the real results that fall out. The downside is that many would probably suffer before it got bad enough for a failed ideology to present itself. In engineering, we like to measure results and learn from the past. In democracy this is a harder task since most folks do not seem to care about real facts versus opinions based on rhetoric. I am not sure our nation could survive the real test that would be required for most folks to reach a sound conclusion. However, I do fancy the idea somewhat of a real sink or swim test for the states and their political choice of affiliations.
_________________
1 U.S. Census Bureau, American FactFinder
2 Are the 10 Poorest U.S. States Really Republican?
3 2014 GOVERNORS AND LEGISLATURES
See also,The 10 Poorest States in the USA are in the Deep South
And, State of the States Report 2014 Local Momentum for National Change to Cut Poverty and Inequality
4 The Big Picture: Facts Concerning History, Politics and the Economy
See also, The Great Lie: The Great Depression and Recessions of the United States