Rather often I feel like listening to the Republicans is like living in Alice’s wonderland. Here are some examples:
Who created more debt Bush or Obama?
The opiate truth: Obama increased the national debt vastly more than any other president.
The non-opiate truth:
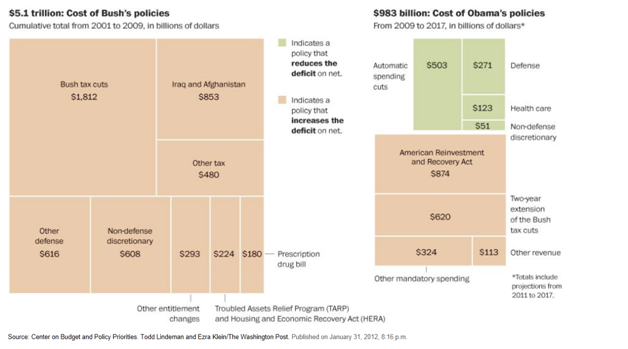
The Graph – Center on Budget and Policy Priorities is non-partisan.
Here are the latest absolute numbers on the debt increase between President Bush and President Obama:
Bush debt increase: 85%
Obama debt increase: 44%
From January 20, 2001 to January 20, 2009 the national debt increased from $5,727,776,738,304.64 to $10,626,877,048,913.08. For those that still believe in arithmetic this is an 85% increase in the debt over the Bush administration’s term ((10,626,877,048,913.08 / 5,727,776,738,304.64) * 100) = 185% or an 85% increase).
From January 20, 2009 to February 3, 2012 the national debt increased from $10,626,877,048,913.08 to $15,330,778,119,850.60. This is a 44% increase in debt over President Obama’s term ((15,330,778,119,850.60 / 10,626,877,048,913.08) * 100) = 143% or a 43% increase).
Don’t take my word for it, check it out on the US Treasury Department site.
Additionally, there is the discretionary and non-discretionary part of the budget. Discretionary spending is annual spending that the congress and the president have to deal with every year; non-discretionary is mandatory, multiyear spending that has already been committed to by previous administrations (i.e., like food stamps calculated to poverty levels). The non-discretionary portion of the 2011 budget is 59%; the discretionary is 34% (reference).
What Republicans call Obama-Care has not kicked in yet but the GAO wrote a report that I have read from start to finish that claims it will take 100 billion off the budget over 10 years as compared to doing nothing (can’t cherry pick GAO reports in my opinion – ask my wife – she retired from the GAO). However, the 1 trillion dollars over 10 years of Medicare Part D that was passed by a Republican president (Bush) and Republican dominated House and Senate has already started to hit non-discretionary spending. The non-discretionary part of the budget makes up the lion’s share of the increased debt spending that you see at the end of the Bush administration. Part is this has to do with the wars, the national disasters (FEMA) and more importantly the recession. As more people go into poverty entitlements that were all previously linked to poverty numbers kick in with much higher amounts of spending – nothing to do with President Obama. This will be discussed more later in this essay.
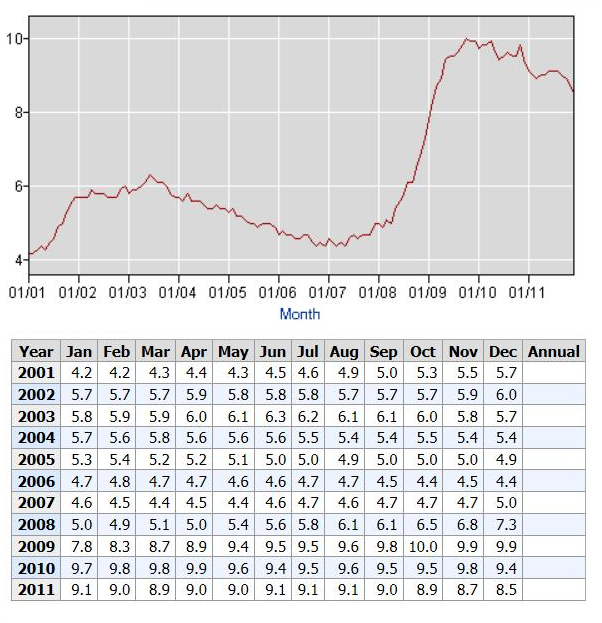
Who created more unemployment Bush or Obama?
The opiate truth: Obama increased unemployment vastly more than any other president.
The non-opiate truth:
Bush increase in unemployment: 86%
Obama increase in unemployment: 6%
When Bush took office on January 20, 2001, the national unemployment rate was 4.2%. When he left office on January 20, 2009 and President Obama took office the national unemployment rate was 7.8%
The current unemployment rate as of January 6, 2012 is 8.3%
Doing the math, the increase during the Bush administration was (7.8 / 4.2) * 100 = 186% or a 86% increase in unemployment. For the Obama administration the math is (8.3 / 7.8) * 100 = 106% or a 6% increase in unemployment.
* Note: I have revised this based the January, 2009 unemployment number of 7.8%. President Obama took office January, 20, 2009. From the graph below you can see that the unemployment rate exploded just as he got into office. I think this explosion arguably was not due to anything President Obama did in his first few months (just 4 months later the rate was 9.4%) as the national unemployment rate does not turn on the dime but I will give the detractors the benefit of the doubt. There is still a huge difference in 86% (Bush) and 6% (Obama). If the numbers from 4 months after President Obama took office are used they work out to:
Bush administration increase in unemployment: 124%
Obama administration decrease in unemployment: 12%
Transition Date: End of May, 2009
Given this, the difference would be a 136% increase in unemployment during the Bush administration over the Obama administration.
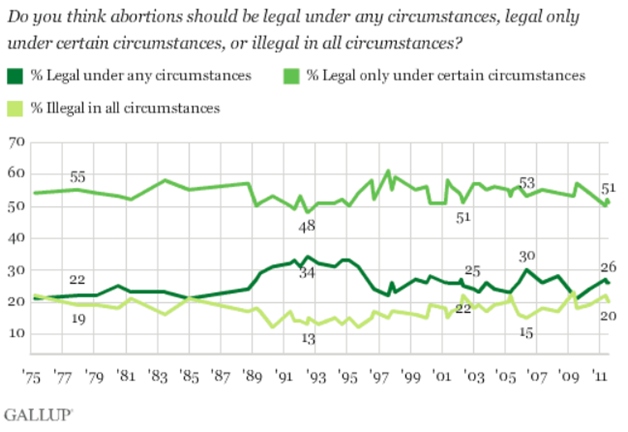
How do Americans feel about abortion?
The opiate truth: The majority of Americans are against abortion.
The non-opiate truth:
Entitlement programs?
The opiate truth: Entitlement programs do not do anything but waste taxpayers money.
The non-opiate truth:

President Obama and food stamps?
The opiate truth: President Obama is the ‘food stamp president’.
The non-opiate truth:
Food stamps have been tied to poverty levels for decades. President Obama has nothing to do with the automatic levels that kicked in due to the recession that started in the Bush administration.
Additionally, many of the entitlement programs are tied by law to the poverty line and/or adjusted income.
Introduction to the Supplemental Security Income (SSI) Program
Interesting chart…

Even with all the additional expenses of non-discretionary entitlement programs kicking in during the Obama administration, the rate of increase of the national debt is still less that the Bush administration.
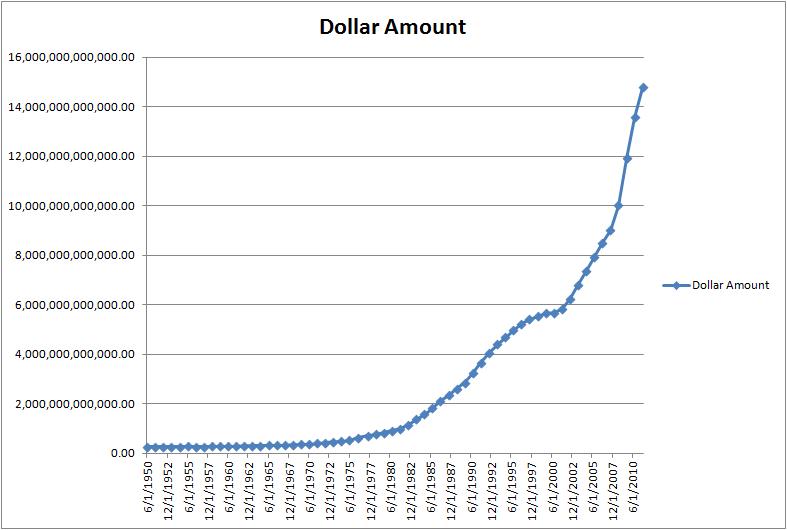
This is a graph of the debt since 1950 (click on the graphs to make them larger)…
This is the rate of increase of the debt since 1950…
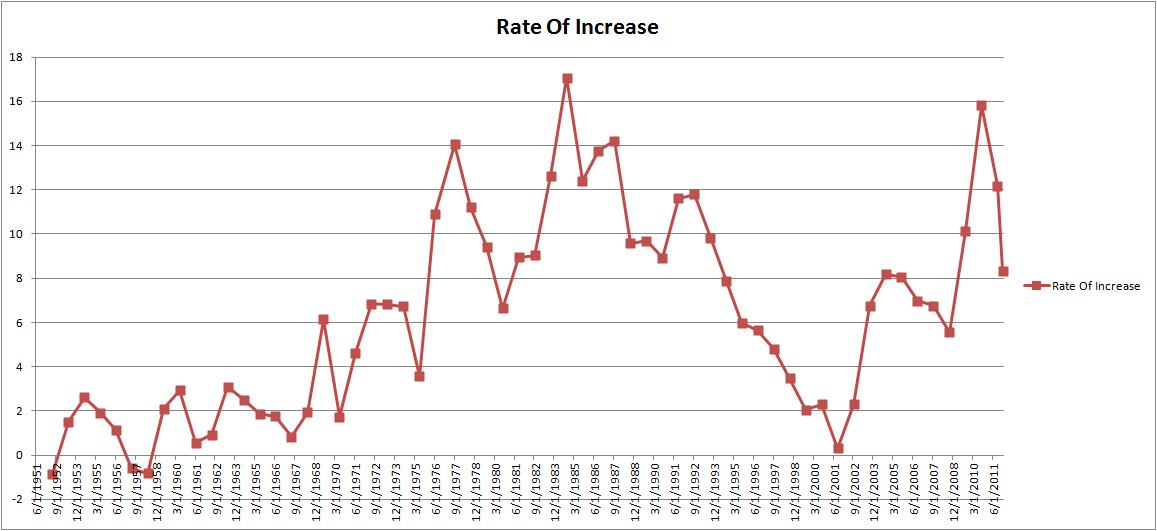
Please note the difference from 2001 to 2009 and 2009 to 2011. This is Bush vs Obama
Note: The graph only uses full fiscal year data. The last fiscal year ended was September 30, 2011
Here is the data and links to the Treasury Department to verify the numbers…

The links shown above are:
Historical Debt Outstanding – Annual 2000 – 2010
Historical Debt Outstanding – Annual 1950 – 1999
The Debt to the Penny and Who Holds It
Debt Position and Activity Report
The Debt to the Penny and Who Holds It (type in Enter Beginning Date: 9/30/11)
Please, don’t vote and do drugs!