With regard to Jeff’s post here.
The data source is here.
Jeff quotes Mandani’s blog claim:
The World Bank’s Investment Climate Department (CIC) has reviewed the recent literature on the relationship between restrictive regulation, corruption and business environment reforms, finding that corruption is positively correlated with restrictive regulation.
Jeff disagrees with Mandani. Here is Jeff’s hypothesis
Correlation does not imply causation. When two events A and B are correlated, one of the following is true:
1. A caused B
2. B caused A
3. Some third factor C caused both A and B
4. A and B happening together are just a coincidence.
The correlation appears significant enough that #4 is unlikely.
It also seems unlikely that the length of time it takes to start a business would cause corruption. Correct me if I’m wrong here.
That leaves either #1 or #3.
I hereby hypothesize that #3 is the culprit, and further that factor C is the power brokering-rich environment resulting from a too-large government.
Jeff thinks that the other factor is “too-large government” which results in a “power brokering-rich environment”. I suppose this means that if the government is too large, corporations will use the government to create regulation to benefit themselves and therefore, result in corruption. I take it that Jeff’s solution would mean a small government which would, in theory, keep large corporations from getting corrupt regulations that benefit themselves. Additionally, in true Austrian School economics fashion, if the government is small the free-market will work more efficient over time and, I assume the conclusion would be, result in less corruption in the system (and certainly in less booms and busts according to Austrian economics). If this is the case, the problem with the purity of the Austrian utopian dream is that this data does not back up that claim. To the contrary, this data counters that claim.
Here is my hypothesis:
Jeff is right with regard to #3 being the culprit. However, Jeff is wrong about the specific other factor (C).
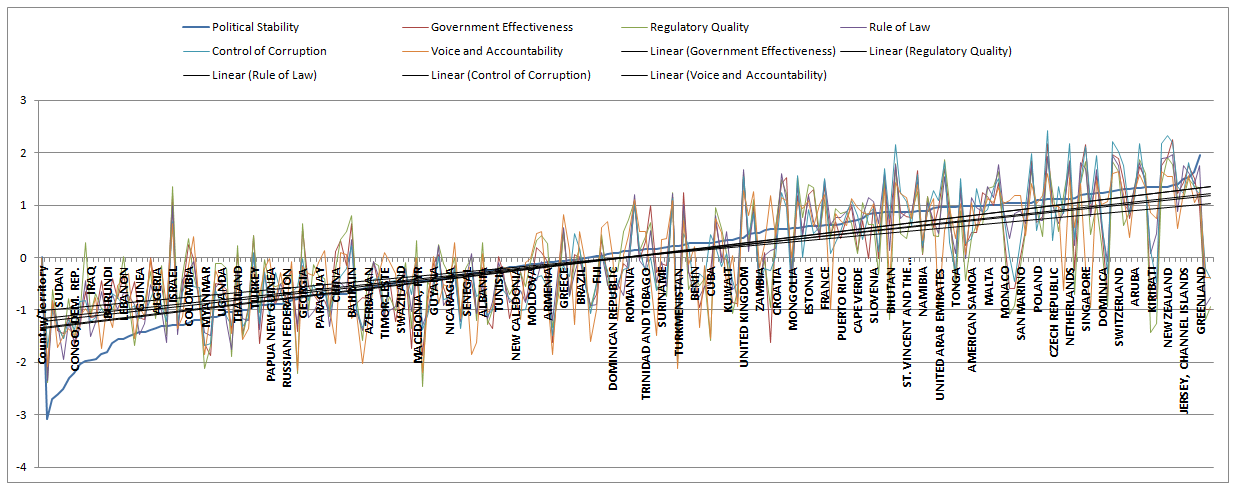
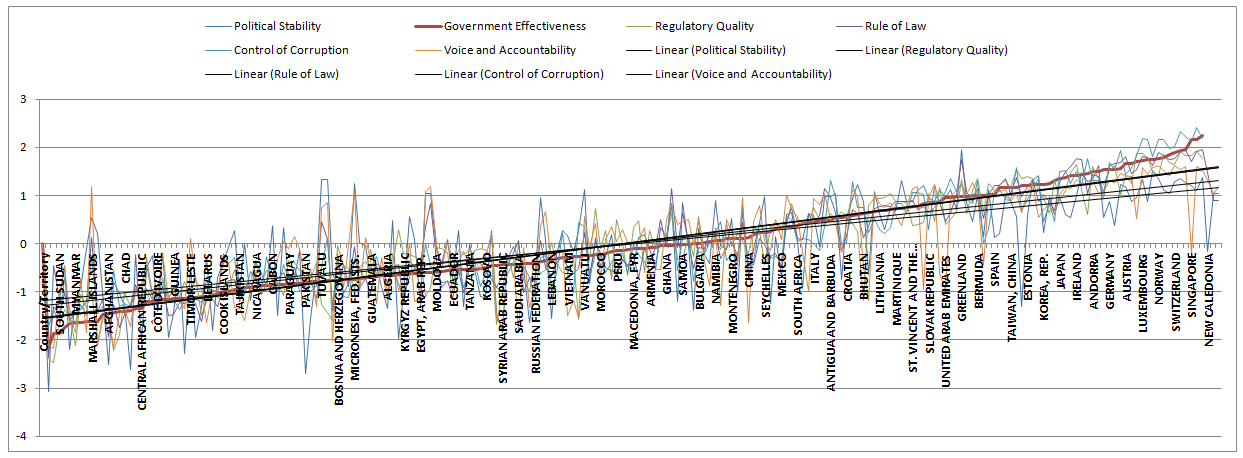
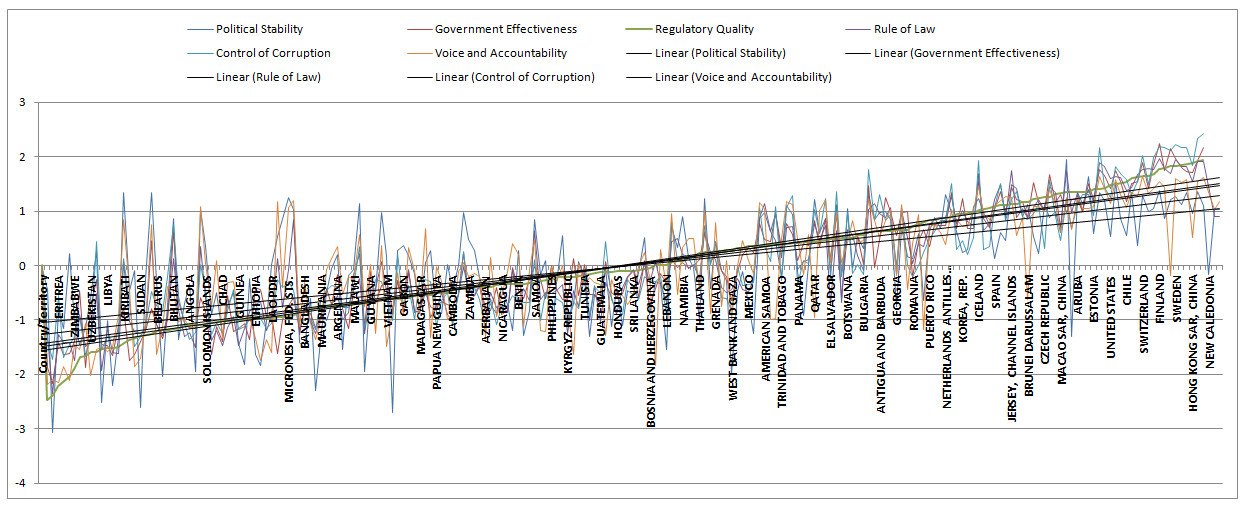
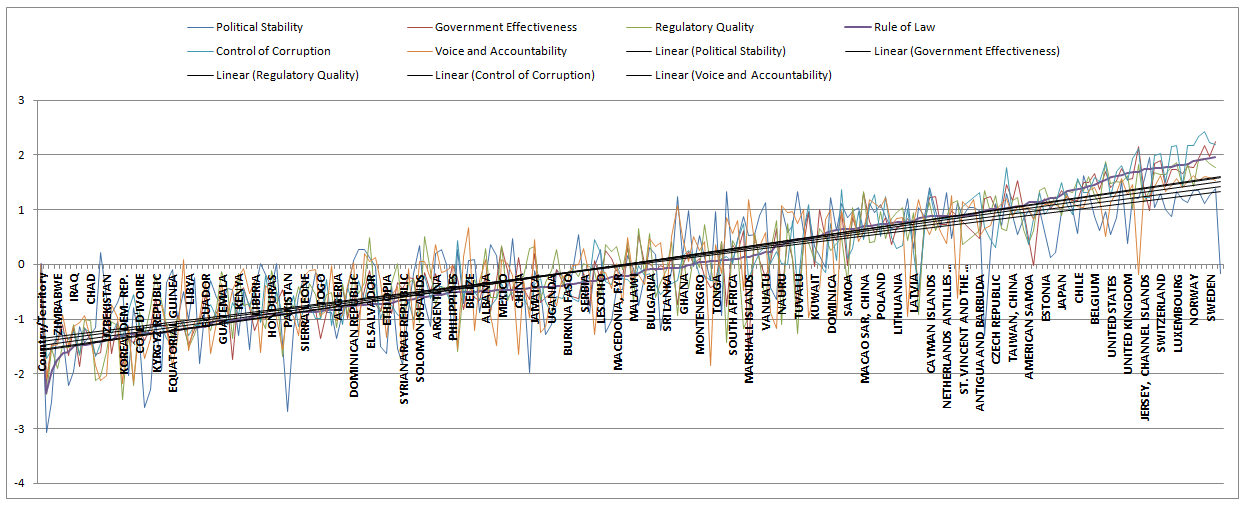
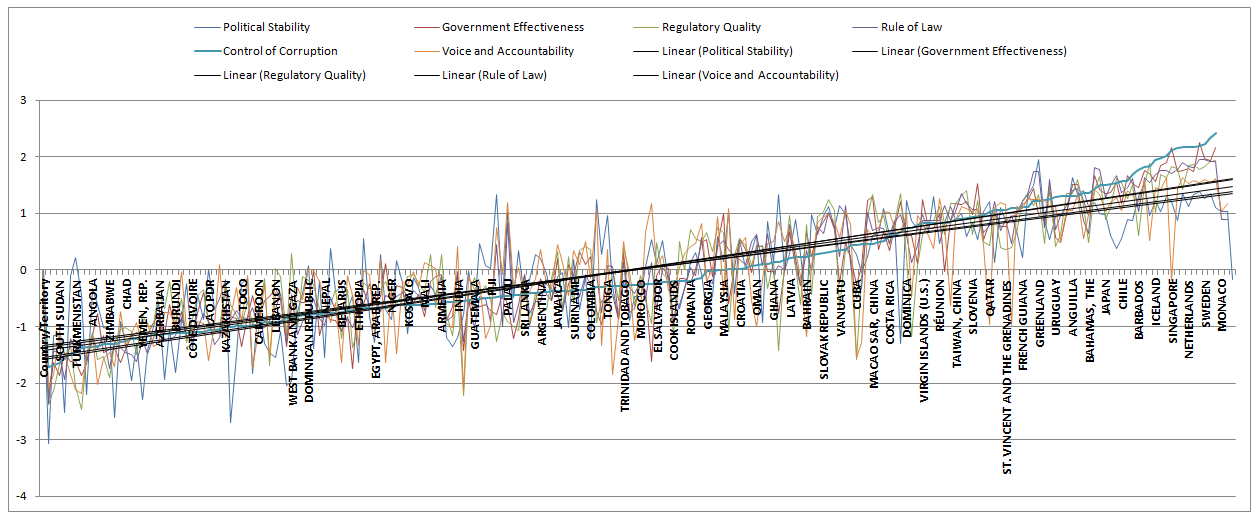
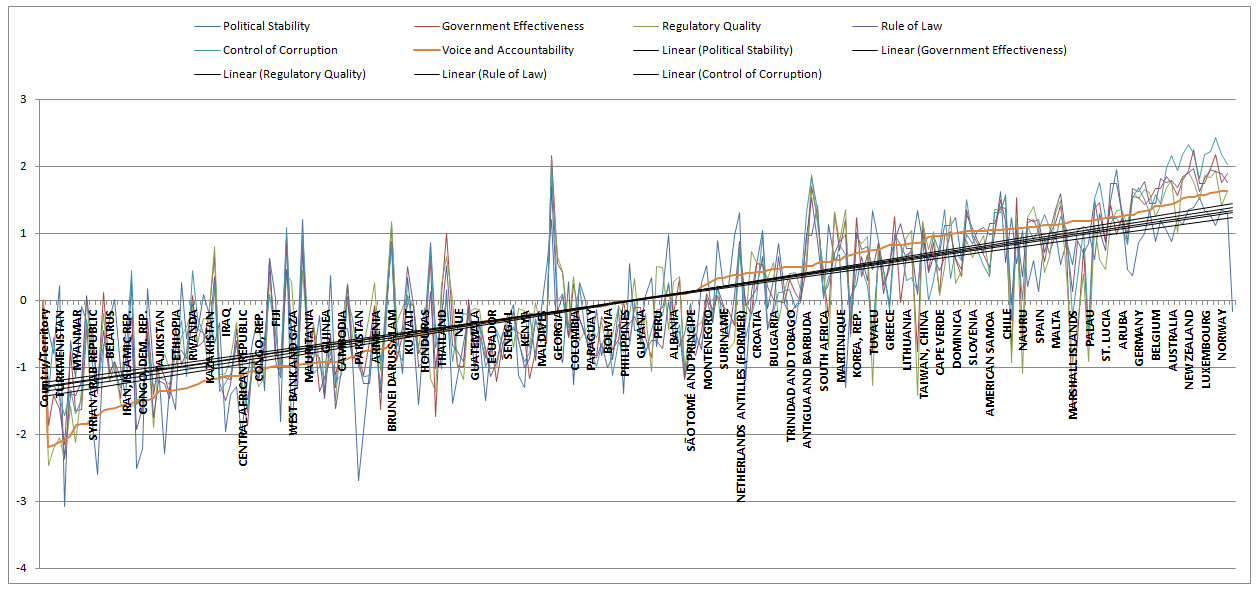
First, I have graphed all the data that the World Bank has accumulated based on their 2011 data, the latest data they provide. You can download their data with my added graphed sheets here. They have 5 benchmarks that they measure for 215 countries:
Political Stability, Government Effectiveness, Regulatory Quality, Control of Corruption, Voice and Accountability
Each of the benchmarks are defined above the graphs and the definitions can be found here.
Each benchmark spans the approximate range from -2.5 to +2.5. Estimates range from approximately -2.5 (weak) to 2.5 (strong).
Each graph shows the data sorted by one benchmark, one column only, from lowest value to highest value. The other benchmarks on the graph falls where they may. We will call the sorted column benchmark the dependent variable as it is the outcome we are comparing to our non-sorted benchmarks, the independent variables. The sorted benchmark for each graph is shown as the thickest line on each graph. Linear trend lines are displayed for each of the other, non-sorted, benchmarks for each graph. This methodology will show the relationship of the other independent variable benchmarks, to the dependent variable, the sorted benchmark, to determine which of the independent variable benchmarks might have a causal relationship to the sorted, dependent variable benchmark. We will also look for any relationships we can see of the benchmarks to each other. Also, we should try to see if Jeff’s hypothesis concerning “too-large government” shows a pattern in any of the dependent variables tested.
What the data shows:
If each of the benchmarks are sorted from low to high, the other non-sorted benchmarks trend lines linearly follow the sorted benchmark upwards. This would indicate that each of the benchmarks play a role in improving the results of the others or, put another way, there is no necessary cause and effect relation established by this data to only one or only some of the independent variable benchmarks to the dependent variable benchmark. All of the independent variable benchmarks appear to effect the dependent variable benchmark causally. For example, less corruption results when improvements are made in political stability, government effectiveness, and voice and accountability and not just regulatory quality. The “Control of Corruption” graph shows that the “Regulatory Quality”, independent variable is not a factor of regulationper se but of political stability, government effectiveness, regulatory quality, control of corruption, voice and accountability. In fact, there is nothing in the data about ‘regulation’ as too much or too little regulation but ‘regulation quality’. Additionally, this data does not add credence to the Austrian School’s claim that the free market is able to regulate itself (if that is indeed the claim of the purist fundamentalists). Neither does this data show any singular correlation to the “restrictiveness” of regulations (“regulation quality”) to corruption. If it did, some (perhaps one could argue some but not all of the benchmarks are overlapping to “regulation quality”) or all of the other benchmark trend lines would not have a positive slope. For example, if political stability is decreased, it seems to indicate that corruption goes up as well. There does not appear to be a singular benchmark that is independent from the others with regard to government corruption (“Control of Corruption”).
Additionally, if you look at the countries that are doing better (closer to 2.5) you will see no correlation between big and small countries or governments. This would seem to indicate the Jeff’s hypothesis is wrong with regard to the absolute or relative size of the government. Since all the countries will not fit on the horizontal axis without making the graph too big I will list where the United States rank is for each benchmark (N/As are not included) and the countries that are ahead of us (closer to 2.5):
Political Stability 136 out of 213
CYPRUS, MONGOLIA, CHILE, ITALY, ESTONIA, MACAO SAR, CHINA, COSTA RICA, FRANCE, OMAN, LITHUANIA, PUERTO RICO, MARTINIQUE, PORTUGAL, CAPE VERDE, HUNGARY, GUAM, SLOVENIA, SAMOA, GERMANY, BHUTAN, AUSTRALIA, ST. LUCIA, ST. VINCENT AND THE GRENADINES, MAURITIUS, BELGIUM, NAMIBIA, TAIWAN, CHINA, URUGUAY, UNITED ARAB EMIRATES, HONG KONG SAR, CHINA, SLOVAK REPUBLIC, TONGA, JAPAN, SEYCHELLES, AMERICAN SAMOA, ANTIGUA AND BARBUDA, VIRGIN ISLANDS (U.S.), MALTA, BERMUDA, IRELAND, MONACO, NAURU, PALAU, SAN MARINO, BOTSWANA, CANADA, POLAND, ST. KITTS AND NEVIS, DENMARK, CZECH REPUBLIC, BAHAMAS, THE, BRUNEI DARUSSALAM, NETHERLANDS, VANUATU, AUSTRIA, SINGAPORE, QATAR, ICELAND, DOMINICA, MICRONESIA, FED. STS., SWEDEN, SWITZERLAND, BARBADOS, NETHERLANDS ANTILLES (FORMER), ARUBA, LUXEMBOURG, ANDORRA, KIRIBATI, TUVALU, NORWAY, NEW ZEALAND, FINLAND, CAYMAN ISLANDS, JERSEY, CHANNEL ISLANDS, LIECHTENSTEIN, ANGUILLA, GREENLAND
Government Effectiveness 188 out of 212
IRELAND, JERSEY, CHANNEL ISLANDS, BARBADOS, ANDORRA, ANGUILLA, CYPRUS, GERMANY, UNITED KINGDOM, ICELAND, AUSTRIA, BELGIUM, HONG KONG SAR, CHINA, LUXEMBOURG, AUSTRALIA, LIECHTENSTEIN, NORWAY, NETHERLANDS, CANADA, SWITZERLAND, NEW ZEALAND, SWEDEN, SINGAPORE, DENMARK, FINLAND
Regulatory Quality 195 out of 212
LIECHTENSTEIN, GERMANY, CHILE, ANDORRA, UNITED KINGDOM, SWITZERLAND, IRELAND, CANADA, FINLAND, AUSTRALIA, SINGAPORE, SWEDEN, NETHERLANDS, LUXEMBOURG, HONG KONG SAR, CHINA, NEW ZEALAND, DENMARK
Control of Corruption 182 out of 212
URUGUAY, ANTIGUA AND BARBUDA, BERMUDA, ANGUILLA, ANDORRA, CAYMAN ISLANDS, BAHAMAS, THE, AUSTRIA, IRELAND, JAPAN, FRANCE, UNITED KINGDOM, CHILE, BELGIUM, GERMANY, BARBADOS, LIECHTENSTEIN, HONG KONG SAR, CHINA, ICELAND, CANADA, SWITZERLAND, SINGAPORE, AUSTRALIA, NORWAY, NETHERLANDS, LUXEMBOURG, FINLAND, SWEDEN, NEW ZEALAND, DENMARK
Voice and Accountability 184 out of 214
ST. VINCENT AND THE GRENADINES, MARSHALL ISLANDS, SAN MARINO, ST. KITTS AND NEVIS, PALAU, FRANCE, BARBADOS, ST. LUCIA, JERSEY, CHANNEL ISLANDS, GREENLAND, ARUBA, RÉUNION, UNITED KINGDOM, GERMANY, IRELAND, ANDORRA, BELGIUM, AUSTRIA, CANADA, AUSTRALIA, ICELAND, NETHERLANDS, NEW ZEALAND, FINLAND, LIECHTENSTEIN, LUXEMBOURG, SWEDEN, DENMARK, NORWAY, SWITZERLAND
A few of my comments:
There are multiple reasons for corruption and it is way too simplistic to blame it on ‘regulation’ (in regard to more or less) alone. It may be fair to suggest that ‘bad’ or ineffective regulation could be one factor in increasing corruption but the data does not independently verify this to be the only factor. We should look at how the World Bank defines corruption:
Control of corruption captures perceptions of the extent to which public power is exercised for private gain, including both petty and grand forms of corruption, as well as “capture” of the state by elites and private interests.
Corporatism = Corruption
Their definition is probably the definition of corporatism (see my related essay on corporatism). By definition, corporatism is corruption. In this case, corporatism and corruption is effectively a tautology. However, the definition does not prove the case, the data does.
Corporatism does not necessarily lead to corruption if you believe the Supreme Court of the United States
This data cannot be contrived to make the claim that regulatory quality alone leads to corruption (or its effective tautological definition in this case – corporatism). It is possible to think that “corporations are people too” and they may actually have the best interest of their communities in addition to the best interest of their bottom line (as the ‘clean coal’ campaign would have us believe1).
Regulation as defined by ‘restricting effectiveness’ does not have to be done by the government and many times is not done by the government
If the free market is to decide there will be large corporations and small businesses. Large corporations can effectively ‘regulate’ the market with or without the government as I have made the case elsewhere. The contention of the Austrians is that this type of private ‘free market regulation’ can be overcome by competition. This may or may not be the case. I would think some of the other benchmarks cited here like “Voice and Accountability” might have an impact on this but this is not demonstrated by the data. Additionally, very large multi-national corporations can effectively evade many regulations and taxes of any particular government by locating their operations in more ‘regulatory or tax friendly’ countries and thus create competitive advantages that would be difficult to overcome in the ‘real’ world.
What this data does not show
This data does not show how regulation may actually reduce corruption (i.e., vis-à-vis conflict of interest banking regulations, bribery, loan sharking and theft laws, abolishing slavery, outlawing child labor, ruining the environment, aircraft maintenance, lead based toys, etc.). If, by definition, public regulation is corrosive and the private market cannot be corrosive to market economies, we may have Austrian ideological purity but restraint of corruption is another issue altogether.
With these points in mind, I personally would conclude that corporatism may lead to corruption but that is not substantiated by this data, by the Supreme Court, by the Republican Party, by public policy alone (without ‘free market’, self-regulation also restricting effectiveness). It is also not apparent by this data that corruption may actually be restricted by public policy.
There are countries2 with much smaller and larger governments that are doing better than the United States regarding the benchmarks relative to their size and government spending versus GDP. If you will notice on the “Control of corruption” benchmark there are countries doing better than us like the “government controlled” health care countries of Canada, United Kingdom and France, the “Euro-Socialists”, and even the king of government bureaucracies, communist China (Hong Kong). I believe China is doing better on all the benchmarks except “Voice and Accountability” than the United States in addition to many of the “Euro-Socialists” and the government controlled health care countries. In my opinion, this disproves Jeff’s hypothesis that corruption (as defined by corporatism) is caused by the size of government vis-à-vis public policy regulation.
What we should all learn:
If an ideology makes short shrift of data in order to validate itself, the ideology functions like a religious dogma not like a falsifiable scientific claim. To the degree that we help each other become more rational (I include myself most of all) is to the same degree that we will have a real and positive effect on our community and help each other become better critical thinkers.
——————————————————————-
What is “governance” according to the World Bank?3
Governance consists of the traditions and institutions by which authority in a country is exercised. This includes the process by which governments are selected, monitored and replaced; the capacity of the government to effectively formulate and implement sound policies; and the respect of citizens and the state for the institutions that govern economic and social interactions among them.
World Bank Data Graphed
Political Stability – Political stability and absence of violence measures perceptions of the likelihood that the government will be destabilized or overthrown by unconstitutional or violent means, including politically-motivated violence and terrorism.
Government Effectiveness – Government effectiveness captures perceptions of the quality of public services, the quality of the civil service and the degree of its independence from political pressures, the quality of policy formulation and implementation, and the credibility of the government’s commitment to such policies.
Regulatory Quality – Regulatory quality captures perceptions of the ability of the government to formulate and implement sound policies and regulations that permit and promote private sector development.
Rule of Law – Rule of law captures perceptions of the extent to which agents have confidence in and abide by the rules of society, and in particular the quality of contract enforcement, property rights, the police, and the courts, as well as the likelihood of crime and violence.
Control of Corruption – Control of corruption captures perceptions of the extent to which public power is exercised for private gain, including both petty and grand forms of corruption, as well as “capture” of the state by elites and private interests.
Voice and Accountability – Voice and accountability captures perceptions of the extent to which a country’s citizens are able to participate in selecting their government, as well as freedom of expression, freedom of association, and a free media.
_________________
1 From the Republican Party Platform adopted in the 2012 convention (Link pdf):
A Failed National Security Strategy
The current Administration’s most recent National
Security Strategy reflects the extreme elements
in its liberal domestic coalition.
…
Finally, the strategy subordinates our national
security interests to environmental, energy, and
international health issues, and elevates “climate
change” to the level of a “severe threat” equivalent to
foreign aggression. The word “climate,” in fact, appears
in the current President’s strategy more often
than Al Qaeda, nuclear proliferation, radical Islam,
or weapons of mass destruction.
One word – SANDY
2 This is a list of all the countries used to compile the data (Link):
AFGHANISTAN , ALBANIA , ALGERIA , AMERICAN SAMOA , ANDORRA , ANGOLA , ANGUILLA , ANTIGUA AND BARBUDA , ARGENTINA , ARMENIA , ARUBA , AUSTRALIA , AUSTRIA , AZERBAIJAN , BAHAMAS, THE , BAHRAIN , BANGLADESH , BARBADOS , BELARUS , BELGIUM , BELIZE , BENIN , BERMUDA , BHUTAN , BOLIVIA , BOSNIA AND HERZEGOVINA , BOTSWANA , BRAZIL , BRUNEI DARUSSALAM , BULGARIA , BURKINA FASO , BURUNDI , CAMBODIA , CAMEROON , CANADA , CAPE VERDE , CAYMAN ISLANDS , CENTRAL AFRICAN REPUBLIC , CHAD , CHILE , CHINA , COLOMBIA , COMOROS , CONGO, DEM. REP. , CONGO, REP. , COOK ISLANDS , COSTA RICA , CÔTE D’IVOIRE , CROATIA , CUBA , CYPRUS , CZECH REPUBLIC , DENMARK , DJIBOUTI , DOMINICA , DOMINICAN REPUBLIC , ECUADOR , EGYPT, ARAB REP. , EL SALVADOR , EQUATORIAL GUINEA , ERITREA , ESTONIA , ETHIOPIA , FIJI , FINLAND , FRANCE , FRENCH GUIANA , GABON , GAMBIA, THE , GEORGIA , GERMANY , GHANA , GREECE , GREENLAND , GRENADA , GUAM , GUATEMALA , GUINEA , GUINEA-BISSAU , GUYANA , HAITI , HONDURAS , HONG KONG SAR, CHINA , HUNGARY , ICELAND , INDIA , INDONESIA , IRAN, ISLAMIC REP. , IRAQ , IRELAND , ISRAEL , ITALY , JAMAICA , JAPAN , JERSEY, CHANNEL ISLANDS , JORDAN , KAZAKHSTAN , KENYA , KIRIBATI , KOREA, DEM. REP. , KOREA, REP. , KOSOVO , KUWAIT , KYRGYZ REPUBLIC , LAO PDR , LATVIA , LEBANON , LESOTHO , LIBERIA , LIBYA , LIECHTENSTEIN , LITHUANIA , LUXEMBOURG , MACAO SAR, CHINA , MACEDONIA, FYR , MADAGASCAR , MALAWI , MALAYSIA , MALDIVES , MALI , MALTA , MARSHALL ISLANDS , MARTINIQUE , MAURITANIA , MAURITIUS , MEXICO , MICRONESIA, FED. STS. , MOLDOVA , MONACO , MONGOLIA , MONTENEGRO , MOROCCO , MOZAMBIQUE , MYANMAR , NAMIBIA , NAURU , NEPAL , NETHERLANDS , NETHERLANDS ANTILLES (FORMER) , NEW CALEDONIA , NEW ZEALAND , NICARAGUA , NIGER , NIGERIA , NIUE , NORWAY , OMAN , PAKISTAN , PALAU , PANAMA , PAPUA NEW GUINEA , PARAGUAY , PERU , PHILIPPINES , POLAND , PORTUGAL , PUERTO RICO , QATAR , RÉUNION , ROMANIA , RUSSIAN FEDERATION , RWANDA , SAMOA , SAN MARINO , SÃO TOMÉ AND PRINCIPE , SAUDI ARABIA , SENEGAL , SERBIA , SEYCHELLES , SIERRA LEONE , SINGAPORE , SLOVAK REPUBLIC , SLOVENIA , SOLOMON ISLANDS , SOMALIA , SOUTH AFRICA , SOUTH SUDAN , SPAIN , SRI LANKA , ST. KITTS AND NEVIS , ST. LUCIA , ST. VINCENT AND THE GRENADINES , SUDAN , SURINAME , SWAZILAND , SWEDEN , SWITZERLAND , SYRIAN ARAB REPUBLIC , TAIWAN, CHINA , TAJIKISTAN , TANZANIA , THAILAND , TIMOR-LESTE , TOGO , TONGA , TRINIDAD AND TOBAGO , TUNISIA , TURKEY , TURKMENISTAN , TUVALU , UGANDA , UKRAINE , UNITED ARAB EMIRATES , UNITED KINGDOM , UNITED STATES , URUGUAY , UZBEKISTAN , VANUATU, VENEZUELA, RB , VIETNAM , VIRGIN ISLANDS (U.S.) , WEST BANK AND GAZA , YEMEN, REP. , ZAMBIA , ZIMBABWE
3 See Link