In the introduction to Ryan’s report, he only shows one scenario from the 2009 CBO Long Term Budget Outlook. His scenario includes not allowing the Bush tax cuts to expire and paying doctors more money for their services than current law dictates (the “doc fix”).
Ryan’s Chart:
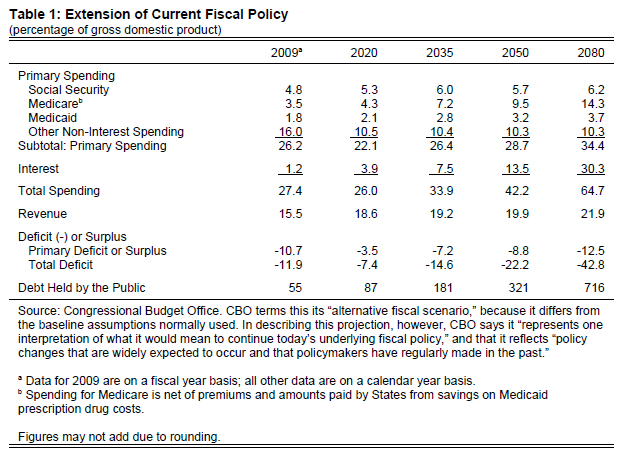
From http://roadmap.republicans.budget.house.gov/plan/#Intro
The Real CBO chart shows this:
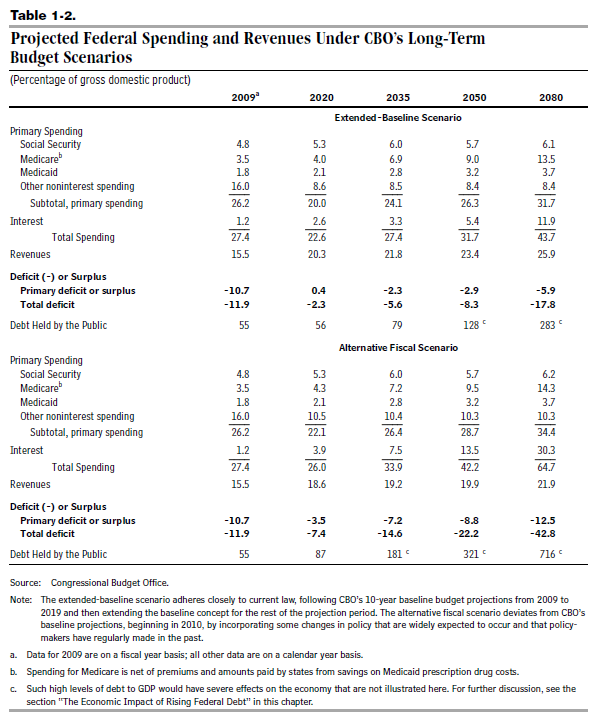
From http://www.cbo.gov/sites/default/files/cbofiles/ftpdocs/102xx/doc10297/06-25-ltbo.pdf, Page 20 (pdf)
Ryan reports states:
According to the Congressional Budget Office [CBO], the President’s policies will increase spending to $5.1 trillion by 2019, nearly a full quarter of the Nation’s economic resources. His deficits never fall below $633 billion in the next 10 years, and exceed $1 trillion by the end of the decade.
Debt as a share of the economy is projected to exceed 60 percent this year (2010) – greater than the 2009 level, which was the highest in 50 years – and will reach 82 percent of GDP by the end of the next decade under the administration’s policies. (In nominal dollars, debt held by the public will triple over the next 10 years.) The U.S. has not seen debt at these expected levels since the end of World War II. Even the countries of the European Union, hardly exemplars of fiscal rectitude, are required to keep their debt levels below 60 percent of GDP.
All this would be bad enough on its own. But it only adds to a fiscal crisis already well under way. The status quo is unsustainable and unacceptable.
For several decades, fiscal experts have warned of the untenable and overwhelming nature of the Federal Government’s budgetary trends. The threat comes entirely from domestic entitlement programs, as clearly reflected in CBO’s biennial report, The Long-Term Budget Outlook, the most recent of which was released in June 2009. The report, looking forward 75 years, shows that within the next several decades, the government’s current fiscal path will lead to catastrophic levels of debt, even if Congress imposed substantial tax increases.
Important points about Ryan’s statement:
- The Congress is responsible for the budget not the president. It is not the “President’s policies” or the “administration’s policies” but the congress’ policies that become law.
- Medicare, part D was not “the president’s policies”. It was President Bush’s policy and cost 1 trillion dollars over 10 years, 100 billion more than ‘ObamaCare’.
- The privatization option for Medicare, champion by the Republicans, the Medicare Advantage cost the taxpayer 12.4% more than the same benefits in Medicare. This is the same money that Reince Priebus recently said President Obama “stole” from Medicare in the Affordable Care Act (ACA). Actually, he took it from Medicare Advantage and put it back in Medicare to save the government money. Priebus is mad because the ACA saved the government money at the expense of his big business, Republican backers in Medicare Advantage. [NOTE 1]
- Additionally, the Center for Medicare and Medicaid Services show ‘ObamaCare’ saves 575 billion dollars in ten years over doing nothing. [NOTE 2]
- The current 2012 Long Term Budget Outlook projects the same scenario in the Ryan plan as “federal debt would grow rapidly from its already high level, exceeding 90 percent of GDP in 2022”. The other scenario sates “Federal debt held by the public would drift downward from an estimated 73 percent of GDP this year to 61 percent by 2022 and 53 percent by 2037” as opposed to “82 percent of GDP by the end of the next decade” which would have been 2019 from 2009. [NOTE 3]
-
The CBO 2009 report that Ryan quotes shows two scenarios. Ryan only shows the worst case scenario. The biggest hits to the worst case scenario are:
- The Bush tax cuts are permanently extended by congress
- The “doc fix” is enacted into law by the congress
President Obama cannot create the budget for the United States. He can give his idea of what the budget should be to the congress but Ryan is not referring to the president’s idea for the budget. He is referring to actual law that can only be made law by the congress. The president of either party never gets their budget made into law carte blanche. To blame current law on President Obama is tantamount to suggesting that President Obama created the entire actual, budget all by himself. This is a HUGE lie. This lie is also used with debt numbers are I have shown here (also, see this link for a discussion of mandatory and discretionary budget items). Ryan is using rhetoric to create an illusion. If people believe rhetoric over facts they will never be able to decide once and for all if their opinion is right or wrong. Ryan does not want people to believe the truth based on real facts. He wants people to believe his hyperbole. There is no integrity to this kind of approach, regardless of political party; it shows something important about the person that resorts to it.
Ryan states this about the Bush tax cuts:
Extension of Current Fiscal Policies. In a scenario that essentially extends today’s underlying fiscal policies, CBO assumes the 2001 and 2003 tax relief provisions and alternative minimum tax [AMT] “patches” are permanently extended. As a result, revenues grow slightly faster than the economy and equal 22 percent of GDP by 2080.
And this about the “doc fix”:
The projection also assumes Medicare physician reimbursement payments will track the historic growth of Medicare rather than the “sustained growth formula” [SGR], which has in recent years called for steep reductions in those payments. (Congress has repeatedly boosted physician payments, an action called the “doc fix.”)
Ryan thinks that the CBO puts an “artificial downward adjustment in the future growth rates of two health entitlements”:
The scenario projects that Social Security, Medicare, and Medicaid will grow faster than the economy. But CBO also makes an artificial downward adjustment in the future growth rates of the two health entitlements. Without this adjustment – applying historical rates of health care spending growth – Medicare and Medicaid spending as a share of the economy (currently 4.9 percent of GDP) would double in 20 years, triple in 30 years, and equal the size of today’s entire government in less than 50 years. Other spending is allowed to grow with GDP rather than inflation after 2011.
The 2012 CBO report states:
In addition, the scenario includes unspecified changes in tax law that would keep revenues constant as a share of GDP after 2022, and it incorporates the assumption that spending for programs other than Social Security and the major federal health care programs will generally represent a stable share of GDP in most years after 2022, as it has in recent decades.
This adjustment is only after 2022. The CBO states that we do not know what GDP is going to be but historically “spending for programs other than Social Security and the major federal health care programs will generally represent a stable share of GDP in most years after 2022, as it has in recent decades”. Ryan thinks that this will not occur and we are on the verge of an a-historic event – GDP going down in a dramatically unusual way. This is speculation on his part. It is perhaps not so odd that it also conveniently fits with his ideological interests. It is pure fantasy on Ryan’s part. The CBO prefers historic precedence.
Ryan states this about Federal revenues:
It is noteworthy that even without deliberate tax increases, tax revenue as a share of the economy is still projected to grow – rising from 15.5 percent of GDP in 2009, to 19.9 percent in 2050, and to 21.9 percent in 2080. For comparison, Federal revenues peaked at 20.9 percent of GDP in 2000. Yet even with revenues at historically high levels, spending still outpaces revenue by significant amounts, leading to more government borrowing and debt, and still higher interest payments.
The 2012 CBO report states in the section “The Long-Term Outlook for Revenues”:
Federal revenues have fluctuated between about 15 percent and about 21 percent of GDP over the past 40 years, averaging 18 percent. The composition of revenues has shifted over time, with payroll taxes producing a larger share of total tax receipts and corporate income taxes and excise taxes producing smaller shares.
This has nothing to do with President Obama as Ryan alludes; Obama has not been in office for 40 years. The CBO goes on to state:
After totaling nearly 18 percent of GDP in 2008, federal revenues fell sharply, primarily because of the severe recession, and were just over 15 percent of GDP from 2009 through 2011. CBO expects revenues to approach 16 percent of GDP this year. Under the current-law assumptions of CBO’s baseline, revenues would rebound over the next few years with expected improvement in the economy, the recent or scheduled expirations of various tax provisions, and the imposition of new taxes, fees, and penalties that are scheduled to go into effect. Revenues would keep rising relative to GDP thereafter, largely because increases in taxpayers’ real income would push more income into higher tax brackets and because more taxpayers would become subject to the AMT. As a result, revenues would reach nearly 19 percent of GDP in 2013 and over 21 percent of GDP in 2022.
With regard to Ryan’s assertion on spending under President Obama, spending has clearly decreased under President Obama than under Bush:
OUTLAYS BY AGENCY: 2000–2017
(in millions of dollars)
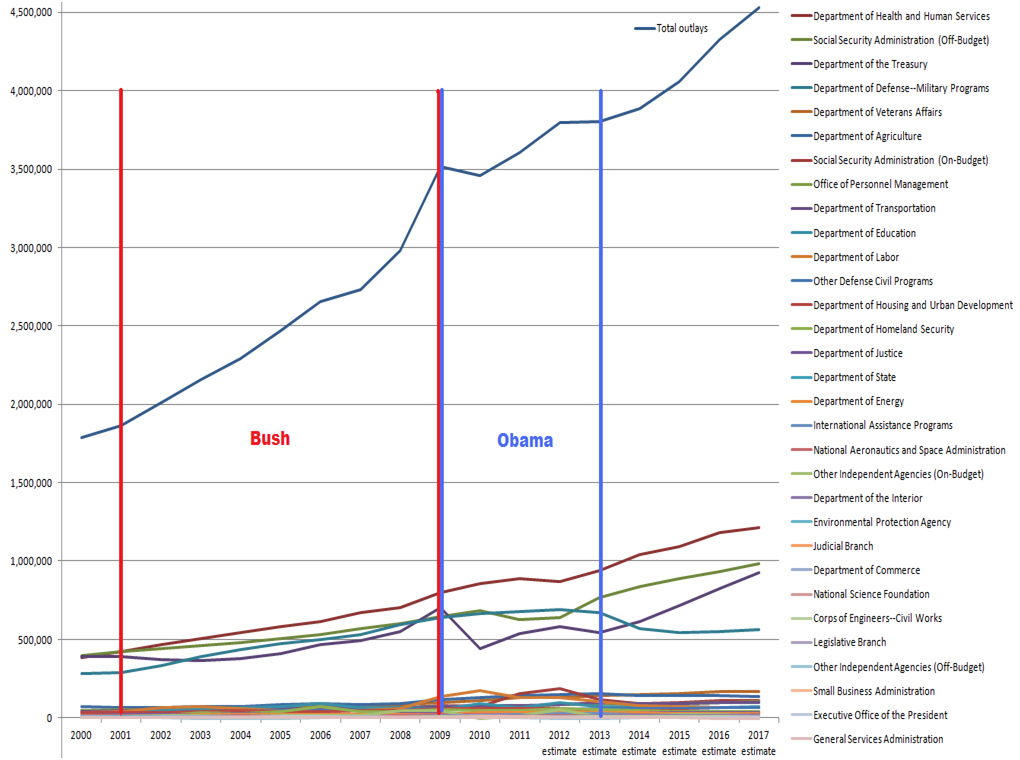
From The Office and Management Budget by agency (xls) or get spreadsheet with graphs here. See also this.
The bottom line is if you repeat rhetoric that is not based on fact, you are responsible for purposely confusing voters. Generally, facts cannot be put in sound bites but they can dispel ideological myths. When voters vote based on lies and manipulation, everyone that spreads that hyperbole is responsible for weakening our democracy. Next time someone tells you that Obama has spent us into oblivion you have the choice of dispelling myth or keeping silent and becoming part of the problem.
……………………………………………
[NOTE 1] The Continuing Cost of Privatization: Extra Payments to Medicare Advantage, Also http://www.pnhp.org/news/2008/july/lets_end_the_medica.php, Also, http://politicalcorrection.org/factcheck/201101250005, Also http://www.gao.gov/products/GAO-08-522T, Also http://www.gao.gov/products/GAO-08-359
Overview
The Medicare Modernization Act of 2003 explicitly increased Medicare payments to private Medicare Advantage (MA) plans. As a result, every MA plan in the nation is paid more for its enrollees than they would have been expected to cost in traditional fee-for-service Medicare. The authors calculate that payments to MA plans in 2008 will be 12.4 percent greater than the corresponding costs in traditional Medicare—an average increase of $986 per MA plan enrollee, for a total of more than $8.5 billion. Over the five-year period 2004–2008, extra payments to MA plans are estimated to have totaled nearly $33 billion. Although Congress recently enacted modest reductions in MA plan payments, these changes will not take effect until 2010. Moreover, while the new legislation removes a few factors contributing to the extra payments, a number of other factors remain unaffected.
[NOTE 2] Center for Medicare and Medicaid Services, Affordable Care Act Update: Implementing Medicare Cost Savings, http://www.cms.gov/apps/docs/ACA-Update-Implementing-Medicare-Costs-Savings.pdf
Without reform, Medicare spending was projected to grow at an average annual rate of 6.8 percent, reaching an annual cost of roughly $978 billion by 2019. As a result of these reform measures, projected annual growth in Medicare spending has been reduced to 5.3 percent, reaching $852 billion by 2019—a ten-year savings of over $575 billion and a reduction of 13 percent in 2019 over previous baseline spending.
…
Conclusion
The passage of the Affordable Care Act marks a turning point in the unsustainable rate of cost growth in our health care system. Prior to reform, Medicare was marred by perverse incentives and inefficiencies that were obstacles to making meaningful quality improvements. This led to the hemorrhaging of billions of dollars in waste and misdirected resources. The Affordable Care Act reforms the Medicare program’s payment and delivery systems to incentivize high-quality care, appropriately price services, modernize the health care sector, and fight waste, fraud, and abuse. The new law will generate significant cost savings in both the near term and the long term, will help drive system-wide cost-savings and quality improvement, and will improve the solvency of the Medicare Trust Fund by 12 years.
[NOTE 3] Congressional Budget Office, THE 2012 LONG-TERM BUDGET OUTLOOK, http://www.cbo.gov/sites/default/files/cbofiles/attachments/LTBO_One-Col_2.pdf
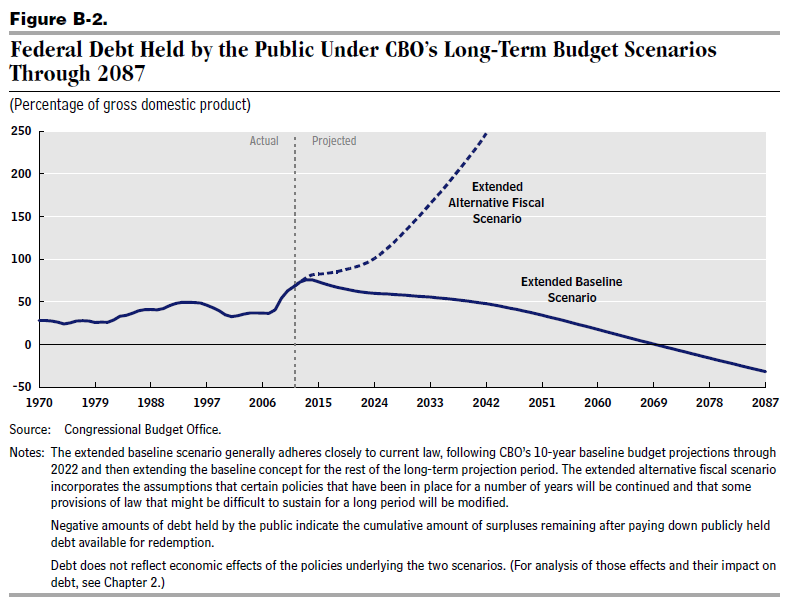
Ryan’s plan is the extended baseline scenario. It assumes the Bush tax cuts are extended and the “doc fix” is enacted. The extended alternative fiscal scenario assumes the Bush tax cuts are allowed to expire, the “doc fix” is not enacted and we do not hit the “fiscal cliff”.
Alternative Scenarios for the Long-Term Budget Outlook
The two sets of long-term budget projections presented in this report are based on the following differing assumptions about future federal policy (see Table 1-1):
- The extended baseline scenario generally adheres closely to current law. It follows CBO’s March 2012 baseline budget projections for the next decade and then extends the baseline concept beyond that 10-year window. The current-law assumption of the baseline scenario implies that many adjustments that lawmakers have routinely made in the past—such as changes to the AMT and to the Medicare program’s payments to physicians—will not be made again. Because of the structure of current tax law, federal revenues over the long run would grow significantly faster than GDP under this scenario, ultimately rising well above the levels that U.S. taxpayers have seen in the past (for more details, see Chapter 6).
- The extended alternative fiscal scenario embodies several changes to current law that would continue certain tax and spending policies that are in place now or have been in place recently. Over the next decade, it follows CBO’s March 2012 budget projections for the alternative fiscal scenario. Versions of some of the changes that the scenario incorporates—such as those related to the tax cuts originally enacted in 2001 and 2003, the AMT, many other expiring tax provisions, and Medicare’s payments to physicians—have regularly been enacted in the past. Another of the scenario’s assumptions is that the automatic spending reductions required by the Budget Control Act of 2011 (Public Law 122-25), which are set to take effect in January 2013, do not occur (although the original caps on discretionary appropriations in that law are assumed to remain in place).