What the Data Shows
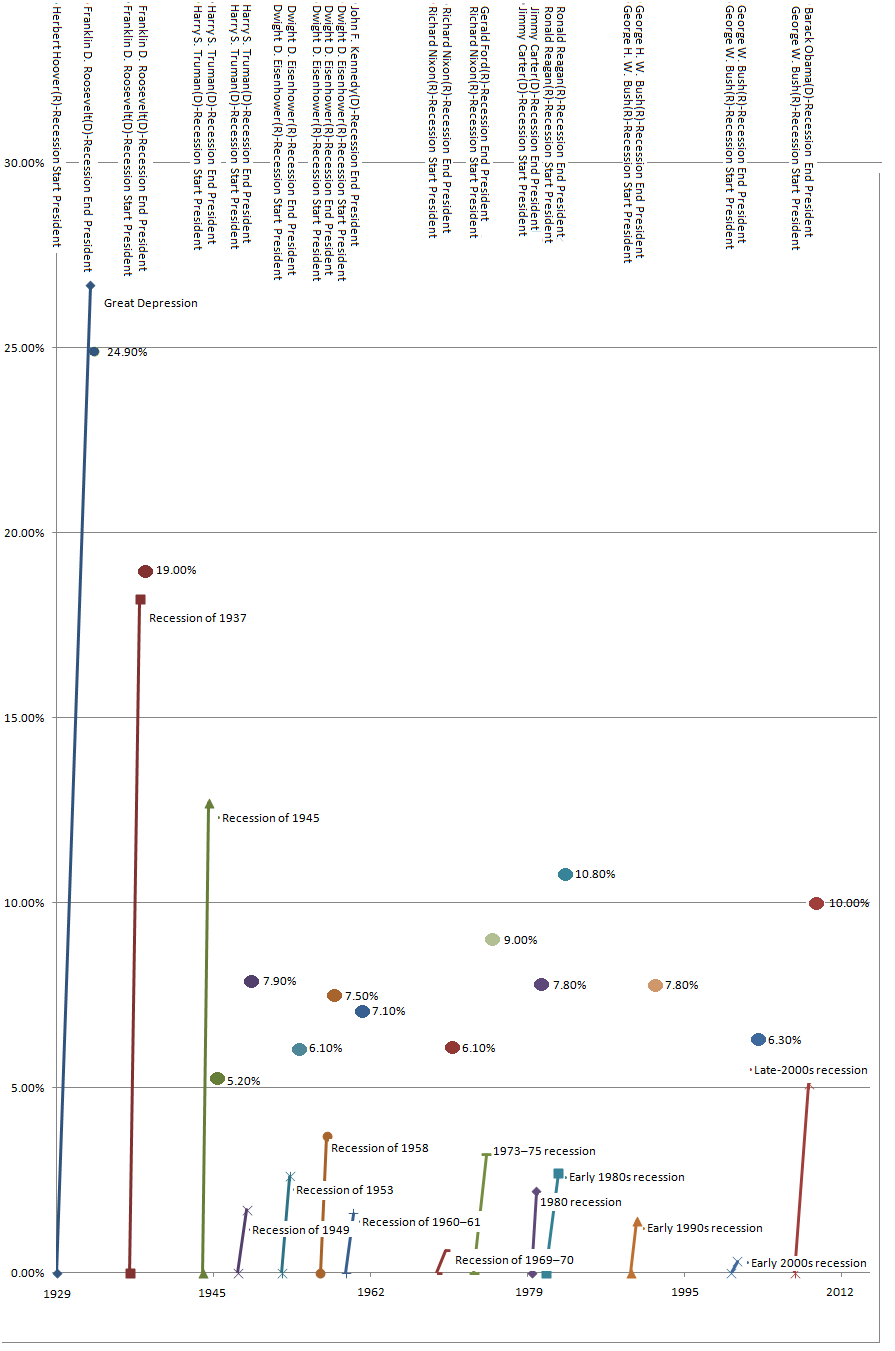
The chart below shows the Great Depression and all the recessions since.
The lines show the drop in GDP during the upheaval and the period of the recession.
The colored dots show the unemployment rate for each event and the peak unemployment date.
Each event shows who the president was and his party at the start and end of the event.
10 events started with a Republican president in office.
4 events started with Democratic president in office.
7 events ended with a Republican president in office.
7 events ended with Democratic president in office.
The “Early 1990s recession” took 15 months from recession end (George H.W. Bush) to peak unemployment.
The “Early 2000s recession” took 19 months from recession end (George W. Bush) to peak unemployment.
All other recession ends to peak unemployments took 4 months or less including the one with President Obama.
Conclusions
President Obama has been blamed for a slow recovery.
If the standard is who is president when the recession ends to peak unemployment then President Obama took 4 months and both Bush Sr. and Bush Jr. took 15 and 19 months respectively.
15 and 19 months to hit peak unemployment from recession end is highly unprecedented from the Great Depression onwards.
Most recessions started when a Republican was in office.
The “Late-2000s recession” started under Bush Jr.
The political rhetoric that the RNC has repeatedly made about President Obama’s handling of the recession is, historically speaking, a lie.
As a Republican, Romney’s track record and economic ideology would be no different than his predecessors.
Please vote according to facts and not lies if you are a responsible voter.
This is the data (the spreadsheet .xls can be downloaded here):
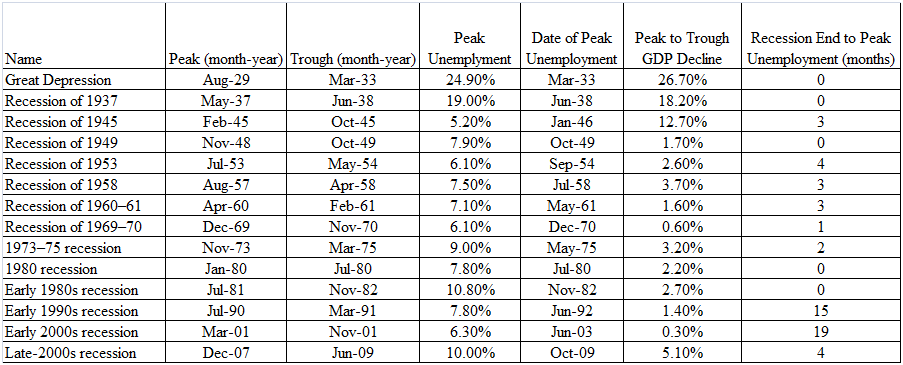
Data Sources: