Category Archives: Politics

Thanks America!

Congratulations President Obama!

In spite of all the dust kicked up by the Republicans in this presidential campaign, there is an enduring shine on our future. In spite of the Citizens United decision and all the billionaires wasted billion+ dollars, albeit a fiscal stimulus from the private sector , the regular folk have stood the test, weathered the BS, separated the wheat from the chaff and preserved the union for the many and not the few. Those whose ideologies protect a shrinking populace from a growing populace cannot survive in this democracy. There are other countries more suited to that pursuit but our citizens have once again affirmed “by the people, for the people and of the people”. Oh yes, it is messy but our optimism, over time, keeps our eyes toward the future and not embroiled in the past. If we will not or cannot change to meet the challenges of the future we will rot in the ‘good ‘ol days’. The economic, free market, purists may prefer their utopist ideals to international and domestic realities but they will continue to get marginalized if they keep telling us to wait for the private market to decide in the face of decades of no decision for health care, elderly, poor, crime, education, disease and fairness. If we had waited for the market’s decision on these matters we would not be a democracy but a plutocracy as every other country in history has repeatedly proven when they embarked on that path. The comes a time when the PEOPLE have to decide. The people have decided that the market is not the panacea for all social ills AND made the decision not to wait for the market’s purported solution. Of course, the elitists will continue to claim that unicorns really do exist and we should wait for them but reality seems to get the attention of the common folk more. Perhaps those that ‘know’ would benefit from a little Socratic ignorance and pay less attention to their sophistic, capitalistic ‘tenure track’ interests.

In addition to the Republican message getting out of touch with changing demographics, they would also do well to not try to “fool all the people all the time”. The strategists obviously thought that given the right amount of money they could position Mitt has a far right winger during the primary and a moderate Republican in the general election. As elitists typically do, they believed that they were smarter than the masses (the 47%) and that people would forget the primaries, forget the lost decade of 2000, and sheepishly follow the correctly pitched party line. What they proved is that people have a better memory than they give them credit for AND trust has to do with ideological consistency. Sophistry does have some short term benefits at times as every liar knows but over time the Sophist acquires a reputation as a liar that cannot be trusted. When the Sophist loses credibility and trust is damaged, the tried and true propagandist tactic of truth as repetition is much harder sell. The Romney strategy of ‘tell them what they want to hear’ duplicity made Romney himself look like a phantasm, not real, and common folk want real people that can perform in real situations in the real world. This is the reason that President Obama won the election. President Obama has an even hand, says what he means, and won the trust of enough of the electorate to stay in office.

While Fox news is in the business of re-creating a ‘brand new world’ the real facts have a pesky way of staying relevant. Fox and friends wanted the American people to believe that the economy was horrible and all of it was due to President Obama but the facts kept popping back up. Fox labels the tendency of facts to keep popping up as the ‘liberal media’. They want to believe that the ‘facts’ they created are not subject to question or debate. Fox has to continually pump up the congregation with a better sermon. This is the problem with creating automatons…they need constant feeding. They cannot feed themselves, fish for themselves, so they need fresh meat daily. It is a Fox News handout of sorts at least as long as they can keep the church large enough to pay their bills. The Heritage Foundation, American Enterprise Institute, and the Cato Institute have a monotone approach in their analysis that makes them overtly partisan and thereby, not credible. Yes, there are liberal think tanks that would like to mimic this behavior but it does not work as well with their natural constituencies. Liberals are plural, more heterogeneous in ethnicity, ideology, self-identity. Homogeneity does not work so well for them. What does work for them is critical thinking, error detection, a sense of facts that I may not like or agree with but still retain the status of ‘truth’. With regard to liberals, they are much more like herding cats than cattle. This is where the conservative ‘think tanks’ go wrong in their assessments. Some folks that are more fear bound and determined, more amygdala dominated, are easier to coral. Folks that are more concerned with responding appropriately to real situations are more engaged in error correcting, anterior cingulate cortex dominated. They need to first believe that there are facts ‘out there’ that is other than what I want or need or like. These folks do not want convenient truths but real truths. Fear paralyzes and creates fantasies in its chronic form. Fear was really only meant in an evolutionary sense to get us to run when a tiger approaches us. It was never meant to create illusions of ever approaching tigers to get us to listen to its council as to how to keep from getting eaten. As such, chronic fear is dysfunctional, delusional and non-adaptive. Eventually, as Joseph McCarthy discovered, the myth of impending doom becomes more of a personal problem that a social ill. This is what Fox, conservative ‘think tanks’ and Republicans risk if they push their methodology too far. Credibility is not faked. Credibility is acquired by having beliefs that are researched from non-partisan, good sources and being open to change if the facts warrant it. This is how folks that are not prone to fear paralysis want to respond to new challenges. Insulting these folks may make the fear mongers feel better about themselves but will not get them into national office when social change is called for to effectively address pressing issues.

For those that believe the end of the world is upon us, I know a lot of folks are going through Fox News withdrawal now and waking up to smell the coffee that many of us think the economy is improving and the future is bright not dark and dismal. The next four years will be even better for the economy and the Democrats. If the Republicans continue to deny the numbers economically and demographically they will find it harder and harder to win national elections. Obstruction, whining and negativity may feel good and make Fox lots of money but becoming part of the solution will keep you in national office. I know many of the doom and gloom prognosticators will only dig in harder but I hope, this time -PLEASE, remember your dire predictions and in four years when we still have a great country with a strong economy…do us all a favor and reflect please!

I think it will be very interesting to see how the Republicans digest this failure. It seems that demographics will absolutely not allow them to dig in deeper and keep on keeping on. Part of their party will absolutely insist that this is the only course. Another part of their party will want to win future national elections and are smart enough to understand why the status quo will not get them there. Change has been thrust upon the conservative base that they cannot ignore any longer. I believe we need authentic conservatives that understand the need to be cautious and preserve what has worked in the past. However, I think the current conservative movement has abandoned the real world that changes and may require ‘adaptations’ to the old ‘tried and true’ methods to continue to be relevant. The balance must be struck with results not ‘ought to be’s, ‘should be’s, denials, anger, insults or utopist idealism. I am not so sure that all of the Republican Party is ready or willing to make these changes and therefore, a great divorce is imminent. When the Dixiecrats were unwilling to make the changes Democrats where demanding they abandoned the Party and joined the Republican Party. If the hard core of the Republican base cannot live with the required practicalities of survival in the national arena they will not join the Democrats but create their own identity to the right of the base that can adapt. I think they would rather die in their ‘rightness’ than live in the requirements of the real world…but I am open to being wrong…we will have to see.

I know that I have been critical at times with the Obama administration with regard to not moving fast enough on issues especially the wars. However, I do want to thank President Obama for all that he has done. The Republican Party wants to say that President Obama was an ineffective leader AND that he was an effective leader in corrupting the nation, the economy and the masses of folks that want handouts. He obviously was an effective leader as they acknowledge at times…they just, in true Sophist fashion, call his effectiveness ineffective. Thanks to Rachel Maddow for compiling this data, I want to end with the accomplishments of the past four years of the Obama administration:

Democratic Government Accomplishments:

Fair Pay Act

New rules on credit card companies

New regulations on tobacco

Federal hate crimes bill

Children’s Health Insurance Protection bill

College student loans by the Department of Education

Serve America Act

Cash for Clunkers

Economic Recovery Package (single largest tax cut in history)

Affordable Care Act

Financial Reform Bill

First Hispanic Supreme Court justice

Cut US and Russia nuclear arms

911 Health Bill

Gays in military (DADT)

Out of Iraq

Getting us out of Afghanistan

No new wars

Killing Osama Bin Laden

Overthrow a dictator in Libya

Most severe sanctions ever on any country against Iran

Marriage equality for same sex couples

Stop deportation of immigrant kids

Stock market doubled

Historic job growth following the Bush recession.

Saving auto industry


PS…

Republican Government Accomplishments:

NO!
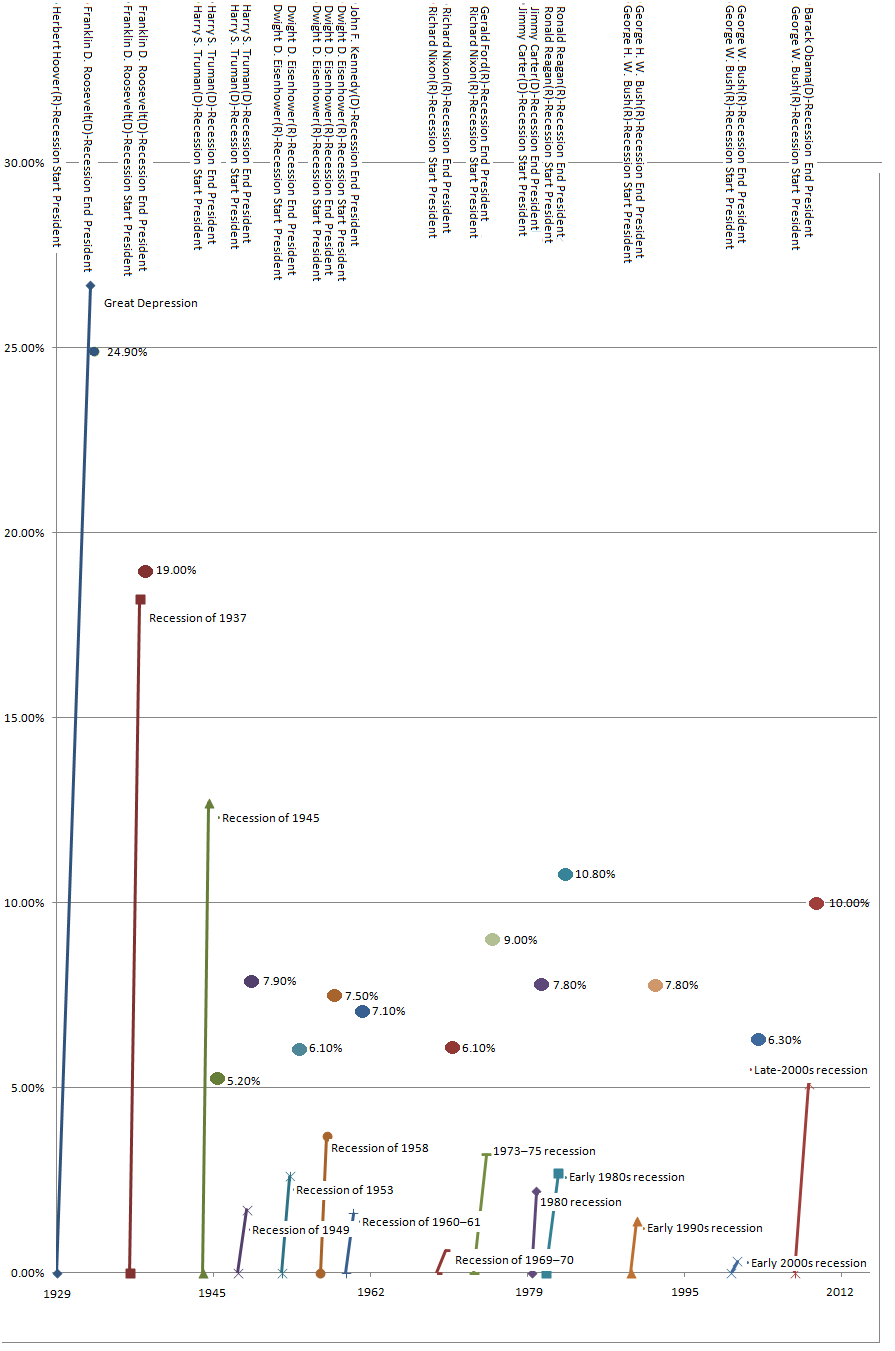


The Great Lie: The Great Depression and Recessions of the United States

What the Data Shows

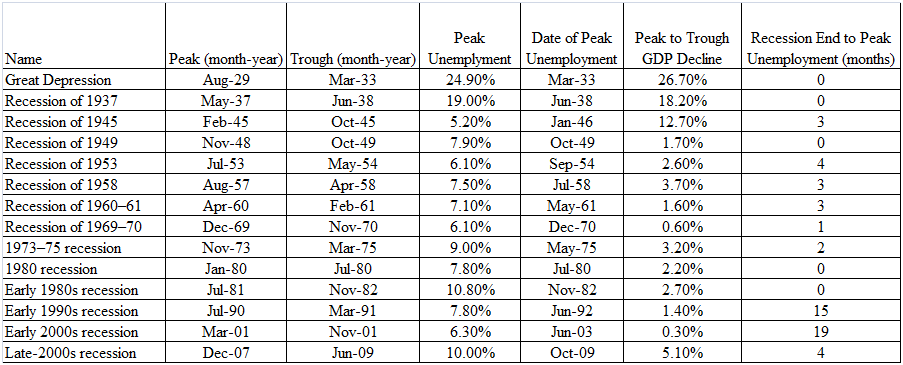
The chart below shows the Great Depression and all the recessions since.

The lines show the drop in GDP during the upheaval and the period of the recession.

The colored dots show the unemployment rate for each event and the peak unemployment date.

Each event shows who the president was and his party at the start and end of the event.

10 events started with a Republican president in office.

4 events started with Democratic president in office.

7 events ended with a Republican president in office.

7 events ended with Democratic president in office.

The “Early 1990s recession” took 15 months from recession end (George H.W. Bush) to peak unemployment.

The “Early 2000s recession” took 19 months from recession end (George W. Bush) to peak unemployment.

All other recession ends to peak unemployments took 4 months or less including the one with President Obama.

Conclusions

President Obama has been blamed for a slow recovery.

If the standard is who is president when the recession ends to peak unemployment then President Obama took 4 months and both Bush Sr. and Bush Jr. took 15 and 19 months respectively.

15 and 19 months to hit peak unemployment from recession end is highly unprecedented from the Great Depression onwards.

Most recessions started when a Republican was in office.

The “Late-2000s recession” started under Bush Jr.

The political rhetoric that the RNC has repeatedly made about President Obama’s handling of the recession is, historically speaking, a lie.

As a Republican, Romney’s track record and economic ideology would be no different than his predecessors.

Please vote according to facts and not lies if you are a responsible voter.

This is the data (the spreadsheet .xls can be downloaded here):

Data Sources:

National Bureau of Economic Research

Wikipedia

Bureau of Labor Statistics

Bureau of Labor Statistics

Top Political Donors

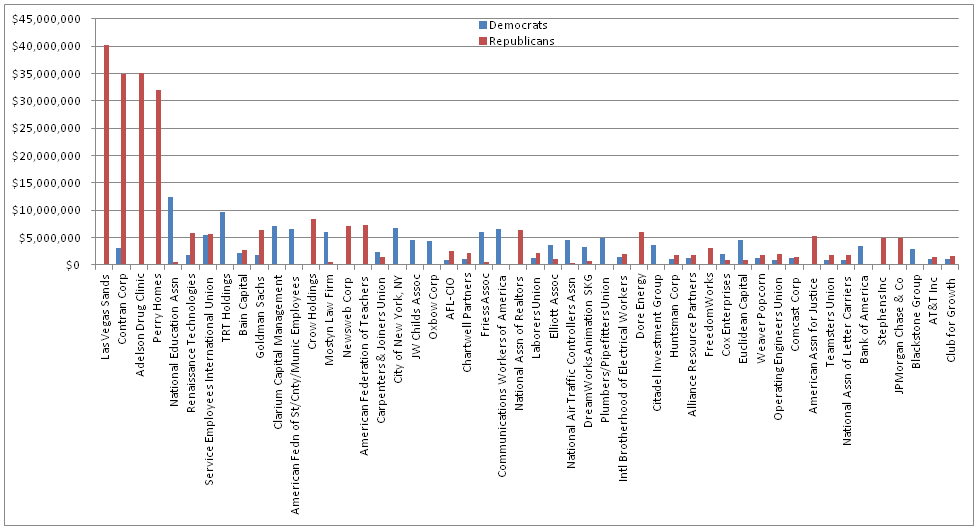
Here is an interesting chart of the top 51 overall donors to the current political campaign.

The web site is here.

You can download my spreadsheet with the charts here (.xls).

This chart is the sum total of direct campaign contributions and superpac contributions.

The total Democratic contributions for the top 101 donors is $187,590,262.

The total Republican contributions for the top 101 donors is $326,833,735.

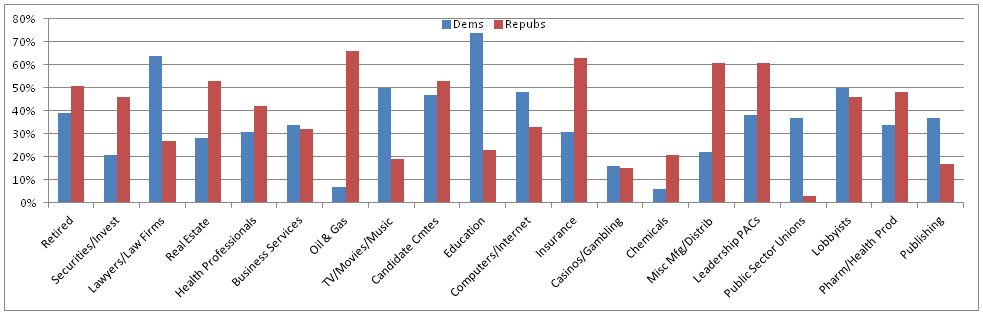
Here is the top 20 donors by industry.

I was wondering why I did not see more Koch brothers so I did a search of Kochs that were donors and surprisingly almost all of them were Republican contributors. I am sure there is no relation – right?

Contributor

Occupation

Date

Amount

Recipient

KOCH, WILLIAM OXBOW CORP./PRESIDENT

9/12/2011

$250,000

Restore Our Future
WEST PALM BEACH,FL 33401
KOCH, ANNA B MS SELF EMPLOYED/VOLUNTEER

2/29/2012

$30,800

National Republican Senatorial Cmte (R)
WICHITA,KS 67202
KOCH, CHARLES KOCH INDUSTRIES

10/3/2011

$30,800

Republican National Cmte (R)
WICHITA,KS 67202
KOCH, CHARLES MR KOCH INDUSTRIES

5/31/2011

$30,800

Republican National Cmte (R)
WICHITA,KS 67201
KOCH, CHRISTOPHER MR NEW ERA CAPITAL

6/22/2012

$30,800

Republican National Cmte (R)
BUFFALO,NY 14202
KOCH, DAVID H MR KOCH INDUSTRIES/EXECUTIVE VP

2/13/2012

$30,800

National Republican Congressional Cmte (R)
WICHITA,KS 67220
KOCH, DAVID H MR KOCH INDUSTRIES, INC.

6/27/2011

$30,800

National Republican Senatorial Cmte (R)
NEW YORK,NY 10065
KOCH, ELIZABETH B MRS HOMEMAKER

4/12/2012

$30,800

National Republican Congressional Cmte (R)
WICHITA,KS 67201
KOCH, JULIA F MRS HOMEMAKER/HOMEMAKER

2/13/2012

$30,800

National Republican Congressional Cmte (R)
WICHITA,KS 67201
KOCH, JULIA F MRS HOMEMAKER

7/22/2012

$30,800

Republican National Cmte (R)
WICHITA,KS 67201
KOCH, STEVEN A CREDIT SUISSE

9/30/2011

$30,800

DNC Services Corp (D)
CHICAGO,IL 60614
KOCH, WILLIAM I MR OXBOW GROUP

1/25/2011

$30,400

National Republican Senatorial Cmte (R)
PALM BEACH,FL 33480
KOCH, C CHASE MR KOCH NITROGEN COMPANY/VICE PRESIDEN

2/29/2012

$30,000

National Republican Senatorial Cmte (R)
WICHITA,KS 67201
KOCH, ELIZABETH MS HOMEMAKER

6/12/2012

$30,000

National Republican Senatorial Cmte (R)
WICHITA,KS 67201
KOCH, JUDY A MRS RETIRED

4/26/2012

$20,000

Republican National Cmte (R)
FREDERICKSBURG,TX 78624
KOCH, C CHASE MR KOCH NITROGEN COMPANY

3/29/2012

$15,400

National Republican Congressional Cmte (R)
WICHITA,KS 67201
KOCH, C CHASE MR KOCH FERTILIZER L.L.C.

3/29/2012

$15,400

Republican National Cmte (R)
WICHITA,KS 67201
KOCH INDUSTRIES INC PAC

2/23/2012

$15,000

Republican National Cmte (R)
WASHINGTON,DC 20005
KOCH, ANNA B MS WESLEY MEDICAL CENTER

3/29/2012

$15,000

National Republican Congressional Cmte (R)
WICHITA,KS 67214
KOCH, ANNA B MS HOMEMAKER

3/29/2012

$15,000

Republican National Cmte (R)
WICHITA,KS 67201
KOCH, CHARLES G MR KOCH INDUSTRIES

6/12/2012

$10,000

National Republican Senatorial Cmte (R)
WICHITA,KS 67201
KOCH, WILLIAM OXBOW GROUP

3/20/2012

$7,500

Rooney, Tom (R)
PALM BEACH,FL 33480
KOCH, WILLIAM OXBOW GROUP

3/20/2012

$7,500

Rooney, Tom (R)
PALM BEACH,FL 33480
KOCHEL, DAVID D MR REDWAVE COMMUNICATIONS

8/9/2012

$7,500

Republican National Cmte (R)
DES MOINES,IA 50312
KOCH, ROBERT L MR II KOCH ENTERPRISES

5/1/2012

$6,000

Republican National Cmte (R)
EVANSVILLE,IN 47714
KOCH, CATHY MRS RETIRED

7/30/2012

$5,300

Republican National Cmte (R)
JOHNSTON,IA 50131
KOCH INDUSTRIES INC POLITICAL ACTION COM

3/31/2012

$5,000

Congressional Leadership Fund
WASHINGTON,DC 20005
KOCH INDUSTRIES INC POLITICAL ACTION COM

12/16/2011

$5,000

Congressional Leadership Fund
WASHINGTON,DC 20005
KOCH, ANNA

3/14/2012

$5,000

Koch Industries
WICHITA,KS 67201
KOCH, ANNA HOMEMAKER

8/9/2011

$5,000

Koch Industries
WICHITA,KS 67201
KOCH, C KOCH FERTILIZER LLC

8/9/2011

$5,000

Koch Industries
WICHITA,KS 67201
KOCH, C C KOCH FERTILIZER LLC

3/14/2012

$5,000

Koch Industries
WICHITA,KS 67220
KOCH, CHARLES KOCH INDUSTRIES INC/CHAIRMAN & CEO

12/5/2011

$5,000

Koch Industries
WICHITA,KS 67220
KOCH, CHARLES KOCH INDUSTRIES INC/CHAIRMAN & CEO

2/8/2012

$5,000

Koch Industries
WICHITA,KS 67220
KOCH, CHARLES J MR RET.

8/10/2012

$5,000

Republican National Cmte (R)
BRATENAHL,OH 44108
KOCH, CHRISTOPHER H NEW ERA CAP COMPANY, INC.

12/13/2011

$5,000

New Era Cap Co
BUFFALO,NY 14202
KOCH, DAVID KOCH CHEM TECH GROUP LLC

6/30/2011

$5,000

Koch Industries
NEW YORK,NY 10021
KOCH, ELIZABETH B KOCH BUSINESS HOLDINGS LLC

12/5/2011

$5,000

Koch Industries
WICHITA,KS 67201
KOCH, ELIZABETH B KOCH BUSINESS HOLDINGS LLC

2/8/2012

$5,000

Koch Industries
WICHITA,KS 67201
KOCH, HEATHER A CME, 20 S. WACKER DR., CHICAGO

4/14/2011

$5,000

Chicago Mercantile Exchange
OAK BROOK,IL 60523
KOCH, KARL MR EAN HOLDINGS, LLC

2/29/2012

$5,000

Enterprise Rent-A-Car
THE WOODLANDS,TX 77382
KOCH, KARL MR EAN HOLDINGS, LLC

4/29/2011

$5,000

Enterprise Rent-A-Car
THE WOODLANDS,TX 77382
KOCH, LINDSEY N/A

12/13/2011

$5,000

New Era Cap Co
BUFFALO,NY 14202
KOCH, ROBERT L MR II KOCH ENTERPRISES

7/20/2012

$5,000

National Republican Congressional Cmte (R)
EVANSVILLE,IN 47714
KOCH, WILLIAM OXBOW CARBON & MINERALS LLC

9/22/2011

$5,000

Oxbow Carbon & Minerals Holdings
WEST PALM BEACH,FL 33401
KOCHEL, DAVID D JDK PUBLIC AFFAIRS LLC

8/21/2012

$5,000

Hawkeye PAC (R)
DES MOINES,IA 50312
Kochman, Cary Allan Mr Citigroup

9/5/2012

$5,000

Republican National Cmte (R)
Wilmette,IL 60091
KOCH, BRIDGET NA

3/31/2011

$4,200

Freedom Project (R)
PALM BEACH,FL 33480
KOCH, DAVID H MR KOCH INDUSTRIES INC.

7/22/2012

$4,200

Republican National Cmte (R)
NEW YORK,NY 10065
KOCH, WILLIAM OXBOW CORP.

10/31/2011

$4,200

Freedom Project (R)
WEST PALM BEACH,FL 33401
KOCH, JULIA F MRS HOMEMAKER/HOMEMAKER

1/24/2012

$3,762

National Republican Senatorial Cmte (R)
WICHITA,KS 67201
KOCH, CHRISTOPHER MR NEW ERA CAPITAL

7/31/2012

$3,550

Oklahoma Leadership Council (R)
BUFFALO,NY 14202
KOCH, CHRISTOPHER MR KOHLER CO.

7/31/2012

$3,550

Republican Party of Idaho (R)
BUFFALO,NY 14202
KOCH, CHRISTOPHER MR NEW ERA CAPITAL

7/31/2012

$3,550

Republican State Cmte of Massachusetts (R)
BUFFALO,NY 14202
KOCH, CHRISTOPHER MR NEW ERA CAPITAL

7/31/2012

$3,550

Vermont Repub Federal Elections Cmte (R)
BUFFALO,NY 14202
KOCH, LARRY J DELOITTE & TOUCHE LLP

1/31/2012

$3,500

Deloitte LLP
WILTON,CT 06897
KOCH, ERIC ALLAN STATE OF INDIANA

8/2/2012

$2,550

Indiana Republican State Central Cmte (R)
BEDFORD,IN 47421
KOCH FERTILIZER, LLC

9/7/2012

$2,500

Romney, Mitt (R)
WICHITA,KS 67201
KOCH FERTILIZER, LLC

9/7/2012

$2,500

Romney, Mitt (R)
WICHITA,KS 67201
KOCH, ANNA

3/12/2012

$2,500

Allen, George (R)
WICHITA,KS 67201
KOCH, ANNA

3/12/2012

$2,500

Allen, George (R)
WICHITA,KS 67201
KOCH, ANNA N/A

3/6/2012

$2,500

Mandel, Josh (R)
WICHITA,KS 67201
KOCH, ANNA N/A

3/6/2012

$2,500

Mandel, Josh (R)
WICHITA,KS 67201
KOCH, ANNA B HOMEMAKER

3/5/2012

$2,500

Berg, Rick (R)
WICHITA,KS 67201
KOCH, ANNA B HOMEMAKER

3/5/2012

$2,500

Berg, Rick (R)
WICHITA,KS 67201
KOCH, ANNA B NONE

3/14/2012

$2,500

Rehberg, Denny (R)
WICHITA,KS 67201
KOCH, ANNA B NONE

3/14/2012

$2,500

Rehberg, Denny (R)
WICHITA,KS 67201
KOCH, ANNA B MS HOMEMAKER

9/7/2012

$2,500

Romney, Mitt (R)
WICHITA,KS 67201
KOCH, ANNA B MS HOMEMAKER

9/7/2012

$2,500

Romney, Mitt (R)
WICHITA,KS 67201
KOCH, ANNA MRS N/A

3/19/2012

$2,500

Barrasso, John A (R)
WICHITA,KS 67201
KOCH, ANNA MRS HOMEMAKER

6/28/2012

$2,500

Pompeo, Mike (R)
WICHITA,KS 67201
KOCH, ANNA MRS HOMEMAKER

6/28/2012

$2,500

Pompeo, Mike (R)
WICHITA,KS 67201
KOCH, BARBARA G MRS RETIRED

9/29/2012

$2,500

Romney, Mitt (R)
PLYMOUTH,MN 55441
KOCH, BRIDGET NONE

5/20/2012

$2,500

Rooney, Tom (R)
JUNO BEACH,FL 33408
KOCH, BRIDGET NONE

5/20/2012

$2,500

Rooney, Tom (R)
JUNO BEACH,FL 33408
KOCH, BRIDGET HOMEMAKER

3/31/2011

$2,500

Boehner, John (R)
PALM BEACH,FL 33480
KOCH, BRIDGET HOMEMAKER

3/31/2011

$2,500

Boehner, John (R)
PALM BEACH,FL 33480
KOCH, BRIDGET MS HOMEMAKER

5/10/2011

$2,500

West, Allen (R)
PALM BEACH,FL 33480
KOCH, BRIDGET MS HOMEMAKER

5/10/2011

$2,500

West, Allen (R)
PALM BEACH,FL 33480
KOCH, BRIDGET ROONEY MS

1/18/2012

$2,500

Romney, Mitt (R)
PALM BEACH,FL 33480
KOCH, C CHASE KOCH FERTILIZER LLC

3/5/2012

$2,500

Berg, Rick (R)
WICHITA,KS 67201
KOCH, C CHASE KOCH FERTILIZER LLC

3/5/2012

$2,500

Berg, Rick (R)
WICHITA,KS 67201
KOCH, C CHASE KOCH FERTILIZER LLC

3/6/2012

$2,500

Mandel, Josh (R)
WICHITA,KS 67201
KOCH, C CHASE KOCH FERTILIZER LLC

3/6/2012

$2,500

Mandel, Josh (R)
WICHITA,KS 67201
KOCH, C CHASE KOCH FERTILIZER LLC

3/14/2012

$2,500

Rehberg, Denny (R)
WICHITA,KS 67201
KOCH, C CHASE KOCH FERTILIZER LLC

3/14/2012

$2,500

Rehberg, Denny (R)
WICHITA,KS 67201
KOCH, CATHY MS RETIRED

7/30/2012

$2,500

Romney, Mitt (R)
JOHNSTON,IA 50131
KOCH, CHARLES KOCH INDUSTRIES, INC.

6/7/2012

$2,500

Allen, George (R)
WICHITA,KS 67201
KOCH, CHARLES KOCH INDUSTRIES, INC.

6/7/2012

$2,500

Allen, George (R)
WICHITA,KS 67201
KOCH, CHARLES KOCH INDUSTRIES

6/12/2012

$2,500

Berg, Rick (R)
WICHITA,KS 67201
KOCH, CHARLES KOCH INDUSTRIES, INC.

6/20/2012

$2,500

Mack, Connie (R)
WICHITA,KS 67201
KOCH, CHARLES KOCH INDUSTRIES

6/15/2012

$2,500

Mandel, Josh (R)
WICHITA,KS 67201
KOCH, CHARLES CHASE KOCH FERTILIZER

6/29/2012

$2,500

Mourdock, Richard E (R)
WICHITA,KS 67201
KOCH, CHARLES CHASE KOCH FERTILIZER

6/13/2012

$2,500

Mourdock, Richard E (R)
WICHITA,KS 67201
KOCH, CHARLES G MR KOCH INDUSTRIES, INC

8/28/2012

$2,500

Romney, Mitt (R)
WICHITA,KS 67201
KOCH, CHARLES G MR KOCH INDUSTRIES, INC

8/28/2012

$2,500

Romney, Mitt (R)
WICHITA,KS 67201
KOCH, CHARLES J MR RETIRED

8/10/2012

$2,500

Romney, Mitt (R)
BRATENAHL,OH 44108
KOCH, CHARLES J MR RETIRED

8/10/2012

$2,500

Romney, Mitt (R)
BRATENAHL,OH 44108
KOCH, CHARLES JAMES BOSTON BEER CO.

7/15/2011

$2,500

Olver, John W (D)
NEWTON,MA 02458
KOCH, CHARLES JAMES MR BOSTON BEER/BREWER

12/16/2011

$2,500

Romney, Mitt (R)
NEWTON,MA 02458
KOCH, CHARLES MR KOCH INDUSTRIES INC.

6/27/2012

$2,500

Heller, Dean (R)
WICHITA,KS 67201
KOCH, CHARLES MR KOCH INDUSTRIES

6/11/2012

$2,500

Pompeo, Mike (R)
WICHITA,KS 67201
KOCH, CHARLES P MR RETIRED

9/28/2012

$2,500

Romney, Mitt (R)
CITRA,FL 32113
KOCH, CHASE KOCH FERTILIZER/VICE PRESIDENT INTE

3/12/2012

$2,500

Allen, George (R)
WICHITA,KS 67201
KOCH, CHASE KOCH FERTILIZER/VICE PRESIDENT INTE

3/12/2012

$2,500

Allen, George (R)
WICHITA,KS 67201
KOCH, CHASE MR KOCH FERTILIZER

3/19/2012

$2,500

Barrasso, John A (R)
WICHITA,KS 67201
KOCH, CHASE MR KOCH FERTILIZER, LLC

6/28/2012

$2,500

Pompeo, Mike (R)
WICHITA,KS 67201
KOCH, CHASE MR KOCH FERTILIZER, LLC

6/28/2012

$2,500

Pompeo, Mike (R)
WICHITA,KS 67201
KOCH, CHRISTINA K N/A

3/14/2011

$2,500

Akin, Todd (R)
TOWN & COUNTRY,MO 63141
KOCH, CHRISTINA K N/A

3/14/2011

$2,500

Akin, Todd (R)
TOWN & COUNTRY,MO 63141
KOCH, CHRISTOPHER MR NEW ERA CAP CO.

4/8/2011

$2,500

Corwin, Jane (R)
BUFFALO,NY 14202
KOCH, CHRISTOPHER MR NEW ERA CAPITAL

6/22/2012

$2,500

Romney, Mitt (R)
BUFFALO,NY 14202
KOCH, CHRISTOPHER MR NEW ERA CAPITAL

6/22/2012

$2,500

Romney, Mitt (R)
BUFFALO,NY 14202
KOCH, COLIN MR INFORMATION REQUESTED PER BEST EFFORTS

6/1/2012

$2,500

Romney, Mitt (R)
MALIBU,CA 90265
KOCH, CYNTHIA SELF

8/8/2011

$2,500

McIntosh, David M (R)
EVANSVILLE,IN 47714
KOCH, CYNTHIA HOMEMAKER/HOMEMAKER

9/29/2011

$2,500

Messer, Luke (R)
EVANSVILLE,IN 47714
KOCH, CYNTHIA NONE

3/16/2011

$2,500

Mourdock, Richard E (R)
EVANSVILLE,IN 47714
KOCH, CYNTHIA NONE

6/14/2012

$2,500

Mourdock, Richard E (R)
EVANSVILLE,IN 47714
KOCH, CYNTHIA R HOMEMAKER

3/23/2011

$2,500

Pence, Mike (R)
EVANSVILLE,IN 47714
KOCH, CYNTHIA R MRS N/A

3/25/2011

$2,500

Bucshon, Larry (R)
EVANSVILLE,IN 47714
KOCH, CYNTHIA R MRS N/A

6/20/2012

$2,500

Bucshon, Larry (R)
EVANSVILLE,IN 47714
KOCH, DAVID KOCH INDUSTRIES, INC.

7/25/2012

$2,500

Mack, Connie (R)
NEW YORK,NY 10065
KOCH, DAVID KOCH INDUSTRIES

12/12/2011

$2,500

McConnell, Mitch (R)
NEW YORK,NY 10065
KOCH, DAVID KOCH INDUSTRIES

12/12/2011

$2,500

McConnell, Mitch (R)
NEW YORK,NY 10065
KOCH, DAVID H KOCH INDUSTRIES, INC.

6/28/2011

$2,500

Hatch, Orrin G (R)
NEW YORK,NY 10065
KOCH, DAVID H KOCH INDUSTRIES, INC.

6/28/2011

$2,500

Hatch, Orrin G (R)
NEW YORK,NY 10065
KOCH, DAVID H MR KOCH INDUSTRIES INC.

7/20/2012

$2,500

Romney, Mitt (R)
NEW YORK,NY 10065
KOCH, DAVID H MR KOCH INDUSTRIES, INC

7/20/2012

$2,500

Romney, Mitt (R)
NEW YORK,NY 10065
KOCH, DAVID M MR BRAHE SUPPLY COMPANY

8/23/2012

$2,500

National Republican Senatorial Cmte (R)
EVANSVILLE,IN 47714
KOCH, DAVID M MR BRAKE SUPPLY COMPANY

5/7/2012

$2,500

Romney, Mitt (R)
EVANSVILLE,IN 47714
KOCH, DAVID MR KOYOTE CAPITAL

9/28/2012

$2,500

Romney, Mitt (R)
NEW CANAAN,CT 06840
KOCH, DAVID MR INFORMATION REQUESTED PER BEST EFFORTS

9/29/2012

$2,500

Romney, Mitt (R)
PLYMOUTH,MN 55441
KOCH, DONALD L KOCH ASSET MANAGEMENT

3/14/2011

$2,500

Akin, Todd (R)
TOWN & COUNTRY,MO 63141
KOCH, DONALD L KOCH ASSET MANAGEMENT

3/14/2011

$2,500

Akin, Todd (R)
TOWN & COUNTRY,MO 63141
Koch, Douglas Baylor

10/17/2012

$2,500

Obama, Barack (D)
Houston,TX 77005
KOCH, ELIZABETH NONE

6/7/2012

$2,500

Allen, George (R)
WICHITA,KS 67201
KOCH, ELIZABETH NONE

6/7/2012

$2,500

Allen, George (R)
WICHITA,KS 67201
KOCH, ELIZABETH HOMEMAKER

6/12/2012

$2,500

Berg, Rick (R)
WICHITA,KS 67201
KOCH, ELIZABETH HOMEMAKER

6/21/2012

$2,500

Mack, Connie (R)
WICHITA,KS 67201
KOCH, ELIZABETH ANNA B NONE

6/29/2012

$2,500

Mourdock, Richard E (R)
WICHITA,KS 67201
KOCH, ELIZABETH ANNA B NONE

6/13/2012

$2,500

Mourdock, Richard E (R)
WICHITA,KS 67201
KOCH, ELIZABETH B MRS HOMEMAKER

6/11/2012

$2,500

Pompeo, Mike (R)
WICHITA,KS 67201
KOCH, ELIZABETH B MRS HOMEMAKER

8/28/2012

$2,500

Romney, Mitt (R)
WICHITA,KS 67201
KOCH, ELIZABETH B MRS HOMEMAKER

8/28/2012

$2,500

Romney, Mitt (R)
WICHITA,KS 67201
KOCH, ELIZABETH MRS HOMEMAKER

6/27/2012

$2,500

Heller, Dean (R)
WICHITA,KS 67201
KOCH, ELIZABETH R N/A

6/15/2012

$2,500

Mandel, Josh (R)
WICHITA,KS 67201
KOCH, ELIZABETH R N/A

3/6/2012

$2,500

Mandel, Josh (R)
WICHITA,KS 67201
KOCH, ELIZABETH R N/A

3/6/2012

$2,500

Mandel, Josh (R)
WICHITA,KS 67201
KOCH, JAMES MR THE BOSTON BEER COMPANY

12/16/2011

$2,500

Brown, Scott (R)
NEWTON,MA 02458
KOCH, JAMES MR THE BOSTON BEER COMPANY

12/16/2011

$2,500

Brown, Scott (R)
NEWTON,MA 02458
KOCH, JUDITH RETIRED

3/24/2011

$2,500

Brown, Scott (R)
MOUNTAIN VIEW,CA 94043
KOCH, JULIA HOUSEWIFE

7/25/2012

$2,500

Mack, Connie (R)
WICHITA,KS 67201
KOCH, JULIA F N/A

6/28/2011

$2,500

Hatch, Orrin G (R)
WICHITA,KS 67201
KOCH, JULIA F N/A

6/28/2011

$2,500

Hatch, Orrin G (R)
WICHITA,KS 67201
KOCH, JULIA F MRS HOMEMAKER

7/20/2012

$2,500

Romney, Mitt (R)
WICHITA,KS 67201
KOCH, JULIA F MRS HOMEMAKER

7/20/2012

$2,500

Romney, Mitt (R)
WICHITA,KS 67201
KOCH, JULIA MS HOMEMAKER

12/12/2011

$2,500

McConnell, Mitch (R)
NEW YORK,NY 10022
KOCH, JULIA MS HOMEMAKER

12/12/2011

$2,500

McConnell, Mitch (R)
NEW YORK,NY 10022
KOCH, MICHAEL I MR

2/15/2012

$2,500

Romney, Mitt (R)
NEW YORK,NY 10065
KOCH, MITCH INFORMATION REQUESTED

11/4/2011

$2,500

Hatch, Orrin G (R)
,WA 98075
KOCH, NATALIE KOCH DEVELOPMENT CORPORATION/VICE P

3/31/2012

$2,500

Crooks, David L (D)
EVANSTON,IN 47531
KOCH, NATALIE C KOCH DEVELOPMENT CORP

9/30/2011

$2,500

Lugar, Richard G (R)
EVANSTON,IN 47531
KOCH, PATRICIA KOCH DEVELOPMENT

6/1/2012

$2,500

Quayle, Ben (R)
SANTA CLAUS,IN 47579
KOCH, PAUL UBS/SR. VP, INVESTMENTS

2/28/2011

$2,500

Freedom Project (R)
WAYZATA,MN 55391
KOCH, ROBERT KOCH ENTERPRISES

6/26/2012

$2,500

Fund for American Exceptionalism (R)
EVANSVILLE,IN 47714
KOCH, ROBERT KOCH ENTERPRISES, INC.

8/8/2011

$2,500

McIntosh, David M (R)
EVANSVILLE,IN 47714
KOCH, ROBERT KOCH ENTERPRISES/PRESIDENT & CEO

6/14/2011

$2,500

Messer, Luke (R)
EVANSVILLE,IN 47714
KOCH, ROBERT II KOCH INDUSTRIES

3/16/2011

$2,500

Mourdock, Richard E (R)
EVANSVILLE,IN 47714
KOCH, ROBERT II KOCH INDUSTRIES

6/14/2012

$2,500

Mourdock, Richard E (R)
EVANSVILLE,IN 47714
KOCH, ROBERT L II GEORGE KOCH & SONS INC

11/2/2011

$2,500

Guthrie, Brett (R)
EVANSVILLE,IN 47714
KOCH, ROBERT L II KOCH ENTERPRISES, INC.

3/23/2011

$2,500

Pence, Mike (R)
EVANSVILLE,IN 47714
KOCH, ROBERT L II KOCH ENTERPRISES, INC.

12/21/2011

$2,500

Rokita, Todd (R)
EVANSVILLE,IN 47714
KOCH, ROBERT L MR II KOCH ENTERPRISES INC.

3/25/2011

$2,500

Bucshon, Larry (R)
EVANSVILLE,IN 47714
KOCH, ROBERT L MR II KOCH ENTERPRISES INC.

6/20/2012

$2,500

Bucshon, Larry (R)
EVANSVILLE,IN 47714
KOCH, ROBERT L MR II KOCH ENTERPRISES, INC.

12/24/2011

$2,500

Coats, Dan (R)
EVANSVILLE,IN 47714
KOCH, ROBERT L MR II KOCH ENTERPRISES

5/1/2012

$2,500

Romney, Mitt (R)
EVANSVILLE,IN 47714
KOCH, SANDY SELF-EMPLOYED

2/1/2012

$2,500

Gingrich, Newt (R)
PLANO,TX 75024
KOCH, SHARLET MRS HOMEMAKER

5/7/2012

$2,500

Romney, Mitt (R)
EVANSVILLE,IN 47714
KOCH, SHARON MS K&J TRUCKING INC

10/9/2012

$2,500

Romney, Mitt (R)
SIOUX FALLS,SD 57108
KOCH, WILLIAM OXBOW CORPORATION

3/31/2011

$2,500

Boehner, John (R)
WEST PALM BEACH,FL 33401
KOCH, WILLIAM OXBOW CORPORATION

3/31/2011

$2,500

Boehner, John (R)
WEST PALM BEACH,FL 33401
KOCH, WILLIAM OXBOW CORPORATION

4/1/2012

$2,500

Mack, Connie (R)
WEST PALM BEACH,FL 33401
KOCH, WILLIAM OXBOW GROUP

3/20/2012

$2,500

Rooney, Tom (R)
PALM BEACH,FL 33480
KOCH, WILLIAM I MR OXBOW GROUP

5/10/2011

$2,500

West, Allen (R)
WEST PALM BEACH,FL 33401
KOCH, WILLIAM I MR OXBOW GROUP

5/10/2011

$2,500

West, Allen (R)
WEST PALM BEACH,FL 33401
KOCH, WILLIAM J MR BK CONTROLS INC.

6/5/2012

$2,500

Boehner, John (R)
ITASCA,IL 60143

RE: “Restrictive regulation is positively correlated with corruption”

With regard to Jeff’s post here.

The data source is here.

Jeff quotes Mandani’s blog claim:

The World Bank’s Investment Climate Department (CIC) has reviewed the recent literature on the relationship between restrictive regulation, corruption and business environment reforms, finding that corruption is positively correlated with restrictive regulation.

Jeff disagrees with Mandani. Here is Jeff’s hypothesis

Correlation does not imply causation. When two events A and B are correlated, one of the following is true:

1. A caused B

2. B caused A

3. Some third factor C caused both A and B

4. A and B happening together are just a coincidence.

The correlation appears significant enough that #4 is unlikely.

It also seems unlikely that the length of time it takes to start a business would cause corruption. Correct me if I’m wrong here.

That leaves either #1 or #3.

I hereby hypothesize that #3 is the culprit, and further that factor C is the power brokering-rich environment resulting from a too-large government.

Jeff thinks that the other factor is “too-large government” which results in a “power brokering-rich environment”. I suppose this means that if the government is too large, corporations will use the government to create regulation to benefit themselves and therefore, result in corruption. I take it that Jeff’s solution would mean a small government which would, in theory, keep large corporations from getting corrupt regulations that benefit themselves. Additionally, in true Austrian School economics fashion, if the government is small the free-market will work more efficient over time and, I assume the conclusion would be, result in less corruption in the system (and certainly in less booms and busts according to Austrian economics). If this is the case, the problem with the purity of the Austrian utopian dream is that this data does not back up that claim. To the contrary, this data counters that claim.

Here is my hypothesis:

Jeff is right with regard to #3 being the culprit. However, Jeff is wrong about the specific other factor (C).

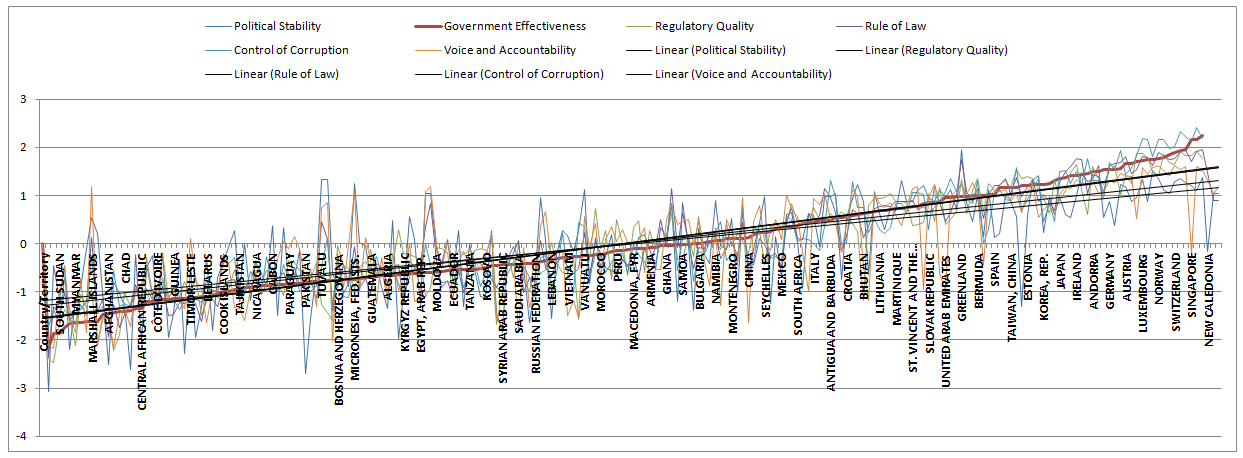
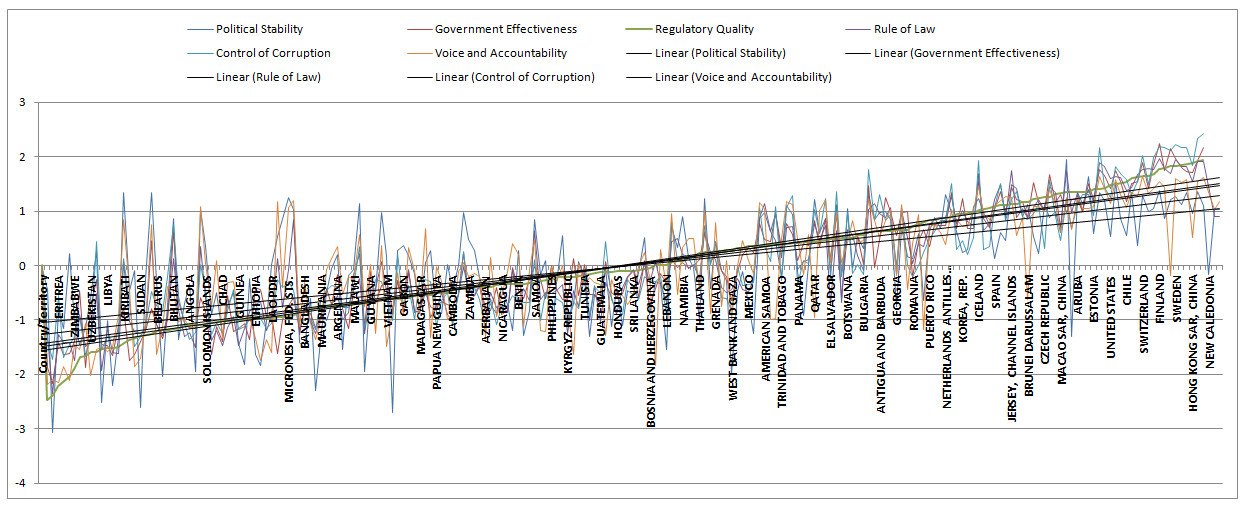
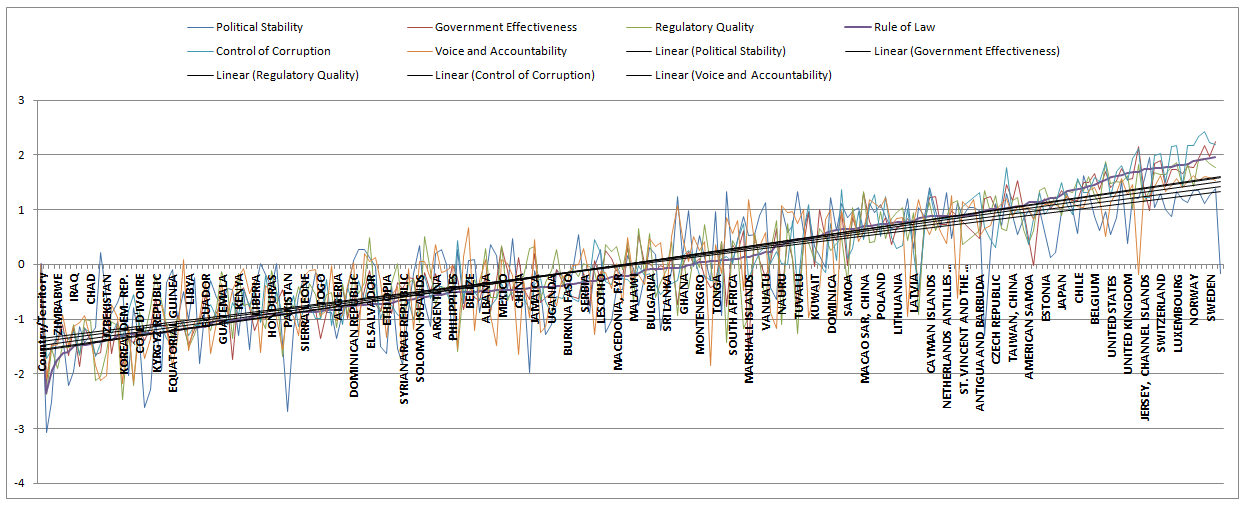
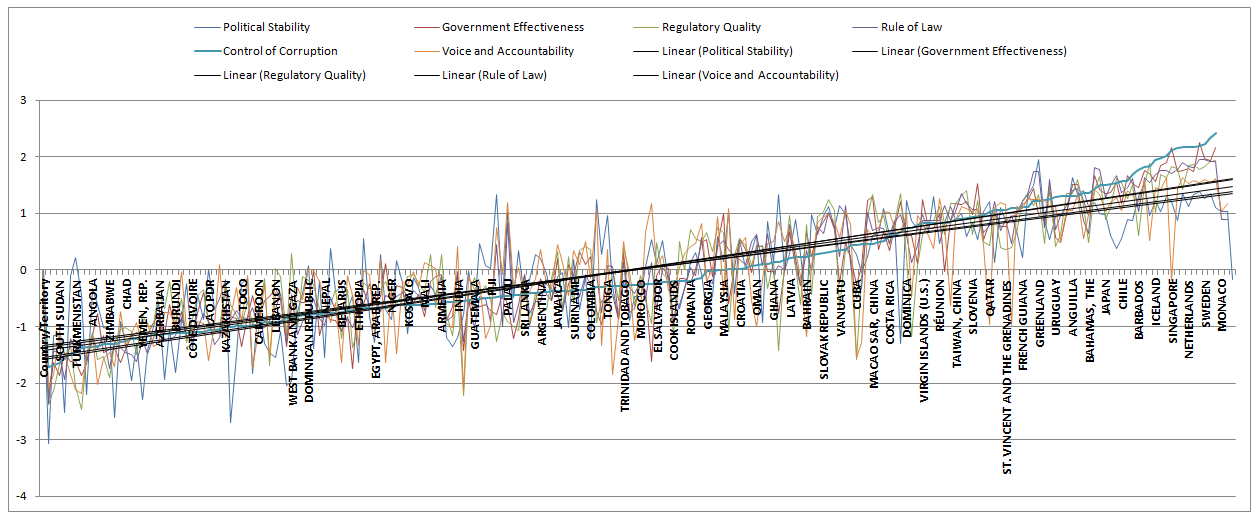
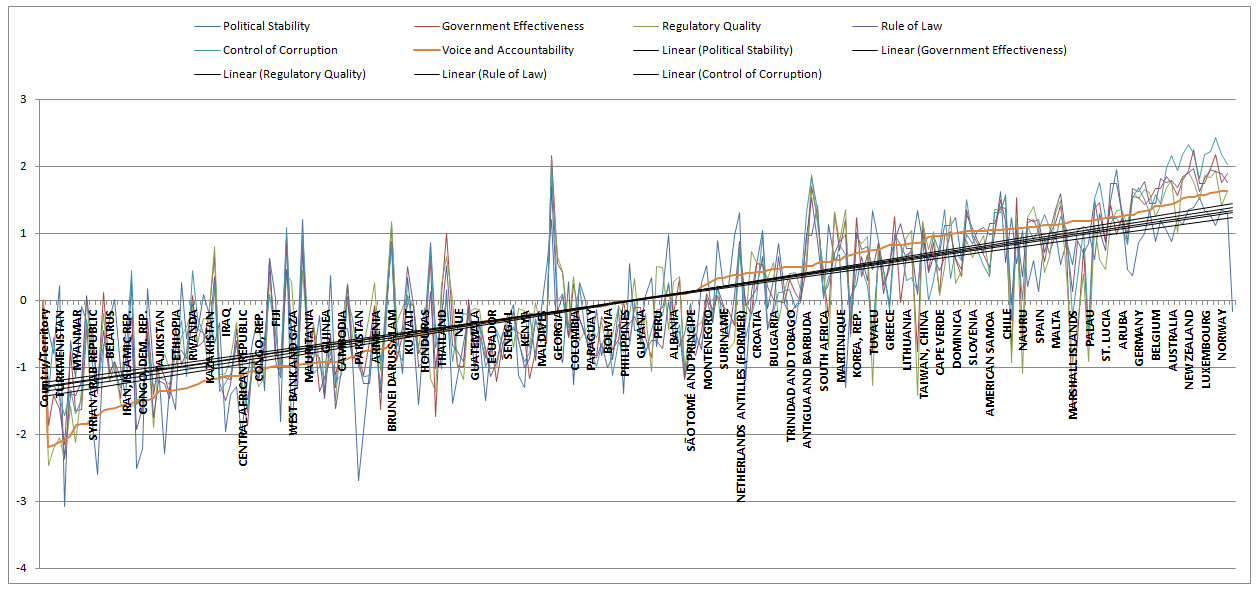
First, I have graphed all the data that the World Bank has accumulated based on their 2011 data, the latest data they provide. You can download their data with my added graphed sheets here. They have 5 benchmarks that they measure for 215 countries:

Political Stability, Government Effectiveness, Regulatory Quality, Control of Corruption, Voice and Accountability

Each of the benchmarks are defined above the graphs and the definitions can be found here.

Each benchmark spans the approximate range from -2.5 to +2.5. Estimates range from approximately -2.5 (weak) to 2.5 (strong).

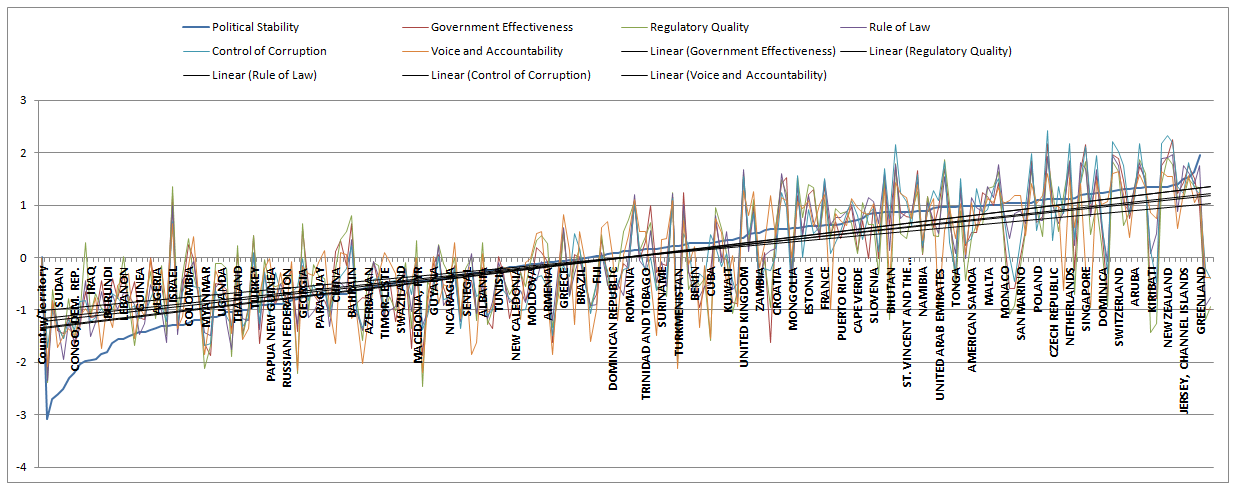
Each graph shows the data sorted by one benchmark, one column only, from lowest value to highest value. The other benchmarks on the graph falls where they may. We will call the sorted column benchmark the dependent variable as it is the outcome we are comparing to our non-sorted benchmarks, the independent variables. The sorted benchmark for each graph is shown as the thickest line on each graph. Linear trend lines are displayed for each of the other, non-sorted, benchmarks for each graph. This methodology will show the relationship of the other independent variable benchmarks, to the dependent variable, the sorted benchmark, to determine which of the independent variable benchmarks might have a causal relationship to the sorted, dependent variable benchmark. We will also look for any relationships we can see of the benchmarks to each other. Also, we should try to see if Jeff’s hypothesis concerning “too-large government” shows a pattern in any of the dependent variables tested.

What the data shows:

If each of the benchmarks are sorted from low to high, the other non-sorted benchmarks trend lines linearly follow the sorted benchmark upwards. This would indicate that each of the benchmarks play a role in improving the results of the others or, put another way, there is no necessary cause and effect relation established by this data to only one or only some of the independent variable benchmarks to the dependent variable benchmark. All of the independent variable benchmarks appear to effect the dependent variable benchmark causally. For example, less corruption results when improvements are made in political stability, government effectiveness, and voice and accountability and not just regulatory quality. The “Control of Corruption” graph shows that the “Regulatory Quality”, independent variable is not a factor of regulation
per se
but of political stability, government effectiveness, regulatory quality, control of corruption, voice and accountability. In fact, there is nothing in the data about ‘regulation’ as too much or too little regulation but ‘regulation quality’. Additionally, this data does not add credence to the Austrian School’s claim that the free market is able to regulate itself (if that is indeed the claim of the purist fundamentalists). Neither does this data show any singular correlation to the “restrictiveness” of regulations (“regulation quality”) to corruption. If it did, some (perhaps one could argue some but not all of the benchmarks are overlapping to “regulation quality”) or all of the other benchmark trend lines would not have a positive slope. For example, if political stability is decreased, it seems to indicate that corruption goes up as well. There does not appear to be a singular benchmark that is independent from the others with regard to government corruption (“Control of Corruption”).

Additionally, if you look at the countries that are doing better (closer to 2.5) you will see no correlation between big and small countries or governments. This would seem to indicate the Jeff’s hypothesis is wrong with regard to the absolute or relative size of the government. Since all the countries will not fit on the horizontal axis without making the graph too big I will list where the United States rank is for each benchmark (N/As are not included) and the countries that are ahead of us (closer to 2.5):

Political Stability 136 out of 213

CYPRUS, MONGOLIA, CHILE, ITALY, ESTONIA, MACAO SAR, CHINA, COSTA RICA, FRANCE, OMAN, LITHUANIA, PUERTO RICO, MARTINIQUE, PORTUGAL, CAPE VERDE, HUNGARY, GUAM, SLOVENIA, SAMOA, GERMANY, BHUTAN, AUSTRALIA, ST. LUCIA, ST. VINCENT AND THE GRENADINES, MAURITIUS, BELGIUM, NAMIBIA, TAIWAN, CHINA, URUGUAY, UNITED ARAB EMIRATES, HONG KONG SAR, CHINA, SLOVAK REPUBLIC, TONGA, JAPAN, SEYCHELLES, AMERICAN SAMOA, ANTIGUA AND BARBUDA, VIRGIN ISLANDS (U.S.), MALTA, BERMUDA, IRELAND, MONACO, NAURU, PALAU, SAN MARINO, BOTSWANA, CANADA, POLAND, ST. KITTS AND NEVIS, DENMARK, CZECH REPUBLIC, BAHAMAS, THE, BRUNEI DARUSSALAM, NETHERLANDS, VANUATU, AUSTRIA, SINGAPORE, QATAR, ICELAND, DOMINICA, MICRONESIA, FED. STS., SWEDEN, SWITZERLAND, BARBADOS, NETHERLANDS ANTILLES (FORMER), ARUBA, LUXEMBOURG, ANDORRA, KIRIBATI, TUVALU, NORWAY, NEW ZEALAND, FINLAND, CAYMAN ISLANDS, JERSEY, CHANNEL ISLANDS, LIECHTENSTEIN, ANGUILLA, GREENLAND

Government Effectiveness 188 out of 212

IRELAND, JERSEY, CHANNEL ISLANDS, BARBADOS, ANDORRA, ANGUILLA, CYPRUS, GERMANY, UNITED KINGDOM, ICELAND, AUSTRIA, BELGIUM, HONG KONG SAR, CHINA, LUXEMBOURG, AUSTRALIA, LIECHTENSTEIN, NORWAY, NETHERLANDS, CANADA, SWITZERLAND, NEW ZEALAND, SWEDEN, SINGAPORE, DENMARK, FINLAND

Regulatory Quality 195 out of 212

LIECHTENSTEIN, GERMANY, CHILE, ANDORRA, UNITED KINGDOM, SWITZERLAND, IRELAND, CANADA, FINLAND, AUSTRALIA, SINGAPORE, SWEDEN, NETHERLANDS, LUXEMBOURG, HONG KONG SAR, CHINA, NEW ZEALAND, DENMARK

Control of Corruption 182 out of 212

URUGUAY, ANTIGUA AND BARBUDA, BERMUDA, ANGUILLA, ANDORRA, CAYMAN ISLANDS, BAHAMAS, THE, AUSTRIA, IRELAND, JAPAN, FRANCE, UNITED KINGDOM, CHILE, BELGIUM, GERMANY, BARBADOS, LIECHTENSTEIN, HONG KONG SAR, CHINA, ICELAND, CANADA, SWITZERLAND, SINGAPORE, AUSTRALIA, NORWAY, NETHERLANDS, LUXEMBOURG, FINLAND, SWEDEN, NEW ZEALAND, DENMARK

Voice and Accountability 184 out of 214

ST. VINCENT AND THE GRENADINES, MARSHALL ISLANDS, SAN MARINO, ST. KITTS AND NEVIS, PALAU, FRANCE, BARBADOS, ST. LUCIA, JERSEY, CHANNEL ISLANDS, GREENLAND, ARUBA, RÉUNION, UNITED KINGDOM, GERMANY, IRELAND, ANDORRA, BELGIUM, AUSTRIA, CANADA, AUSTRALIA, ICELAND, NETHERLANDS, NEW ZEALAND, FINLAND, LIECHTENSTEIN, LUXEMBOURG, SWEDEN, DENMARK, NORWAY, SWITZERLAND

A few of my comments:

There are multiple reasons for corruption and it is way too simplistic to blame it on ‘regulation’ (in regard to more or less) alone. It may be fair to suggest that ‘bad’ or ineffective regulation could be one factor in increasing corruption but the data does not independently verify this to be the only factor. We should look at how the World Bank defines corruption:

Control of corruption captures perceptions of the extent to which public power is exercised for private gain, including both petty and grand forms of corruption, as well as “capture” of the state by elites and private interests.

Corporatism = Corruption

Their definition is probably the definition of corporatism (see my related essay on corporatism). By definition, corporatism is corruption. In this case, corporatism and corruption is effectively a tautology. However, the definition does not prove the case, the data does.

Corporatism does not necessarily lead to corruption if you believe the Supreme Court of the United States

This data cannot be contrived to make the claim that regulatory quality alone leads to corruption (or its effective tautological definition in this case – corporatism). It is possible to think that “corporations are people too” and they may actually have the best interest of their communities in addition to the best interest of their bottom line (as the ‘clean coal’ campaign would have us believe1).

Regulation as defined by ‘restricting effectiveness’ does not have to be done by the government and many times is not done by the government

If the free market is to decide there will be large corporations and small businesses. Large corporations can effectively ‘regulate’ the market with or without the government as I have made the case elsewhere. The contention of the Austrians is that this type of private ‘free market regulation’ can be overcome by competition. This may or may not be the case. I would think some of the other benchmarks cited here like “Voice and Accountability” might have an impact on this but this is not demonstrated by the data. Additionally, very large multi-national corporations can effectively evade many regulations and taxes of any particular government by locating their operations in more ‘regulatory or tax friendly’ countries and thus create competitive advantages that would be difficult to overcome in the ‘real’ world.

What this data does not show

This data does not show how regulation may actually reduce corruption (i.e., vis-à-vis conflict of interest banking regulations, bribery, loan sharking and theft laws, abolishing slavery, outlawing child labor, ruining the environment, aircraft maintenance, lead based toys, etc.). If, by definition, public regulation is corrosive and the private market cannot be corrosive to market economies, we may have Austrian ideological purity but restraint of corruption is another issue altogether.

With these points in mind, I personally would conclude that corporatism may lead to corruption but that is not substantiated by this data, by the Supreme Court, by the Republican Party, by public policy alone (without ‘free market’, self-regulation also restricting effectiveness). It is also not apparent by this data that corruption may actually be restricted by public policy.

There are countries2 with much smaller and larger governments that are doing better than the United States regarding the benchmarks relative to their size and government spending versus GDP. If you will notice on the “Control of corruption” benchmark there are countries doing better than us like the “government controlled” health care countries of Canada, United Kingdom and France, the “Euro-Socialists”, and even the king of government bureaucracies, communist China (Hong Kong). I believe China is doing better on all the benchmarks except “Voice and Accountability” than the United States in addition to many of the “Euro-Socialists” and the government controlled health care countries. In my opinion, this disproves Jeff’s hypothesis that corruption (as defined by corporatism) is caused by the size of government vis-à-vis public policy regulation.

What we should all learn:

If an ideology makes short shrift of data in order to validate itself, the ideology functions like a religious dogma not like a falsifiable scientific claim. To the degree that we help each other become more rational (I include myself most of all) is to the same degree that we will have a real and positive effect on our community and help each other become better critical thinkers.

——————————————————————-

What is “governance” according to the World Bank?3

Governance consists of the traditions and institutions by which authority in a country is exercised. This includes the process by which governments are selected, monitored and replaced; the capacity of the government to effectively formulate and implement sound policies; and the respect of citizens and the state for the institutions that govern economic and social interactions among them.

World Bank Data Graphed

Political Stability – Political stability and absence of violence measures perceptions of the likelihood that the government will be destabilized or overthrown by unconstitutional or violent means, including politically-motivated violence and terrorism.

Government Effectiveness – Government effectiveness captures perceptions of the quality of public services, the quality of the civil service and the degree of its independence from political pressures, the quality of policy formulation and implementation, and the credibility of the government’s commitment to such policies.

Regulatory Quality – Regulatory quality captures perceptions of the ability of the government to formulate and implement sound policies and regulations that permit and promote private sector development.

Rule of Law – Rule of law captures perceptions of the extent to which agents have confidence in and abide by the rules of society, and in particular the quality of contract enforcement, property rights, the police, and the courts, as well as the likelihood of crime and violence.

Control of Corruption – Control of corruption captures perceptions of the extent to which public power is exercised for private gain, including both petty and grand forms of corruption, as well as “capture” of the state by elites and private interests.

Voice and Accountability – Voice and accountability captures perceptions of the extent to which a country’s citizens are able to participate in selecting their government, as well as freedom of expression, freedom of association, and a free media.

_________________

1 From the Republican Party Platform adopted in the 2012 convention (Link pdf):


A Failed National Security Strategy

The current Administration’s most recent National

Security Strategy reflects the extreme elements

in its liberal domestic coalition.


Finally, the strategy subordinates our national

security interests to environmental, energy, and

international health issues, and elevates “climate

change” to the level of a “severe threat” equivalent to

foreign aggression. The word “climate,” in fact, appears

in the current President’s strategy more often

than Al Qaeda, nuclear proliferation, radical Islam,

or weapons of mass destruction.

One word – SANDY

2 This is a list of all the countries used to compile the data (Link):

AFGHANISTAN , ALBANIA , ALGERIA , AMERICAN SAMOA , ANDORRA , ANGOLA , ANGUILLA , ANTIGUA AND BARBUDA , ARGENTINA , ARMENIA , ARUBA , AUSTRALIA , AUSTRIA , AZERBAIJAN , BAHAMAS, THE , BAHRAIN , BANGLADESH , BARBADOS , BELARUS , BELGIUM , BELIZE , BENIN , BERMUDA , BHUTAN , BOLIVIA , BOSNIA AND HERZEGOVINA , BOTSWANA , BRAZIL , BRUNEI DARUSSALAM , BULGARIA , BURKINA FASO , BURUNDI , CAMBODIA , CAMEROON , CANADA , CAPE VERDE , CAYMAN ISLANDS , CENTRAL AFRICAN REPUBLIC , CHAD , CHILE , CHINA , COLOMBIA , COMOROS , CONGO, DEM. REP. , CONGO, REP. , COOK ISLANDS , COSTA RICA , CÔTE D’IVOIRE , CROATIA , CUBA , CYPRUS , CZECH REPUBLIC , DENMARK , DJIBOUTI , DOMINICA , DOMINICAN REPUBLIC , ECUADOR , EGYPT, ARAB REP. , EL SALVADOR , EQUATORIAL GUINEA , ERITREA , ESTONIA , ETHIOPIA , FIJI , FINLAND , FRANCE , FRENCH GUIANA , GABON , GAMBIA, THE , GEORGIA , GERMANY , GHANA , GREECE , GREENLAND , GRENADA , GUAM , GUATEMALA , GUINEA , GUINEA-BISSAU , GUYANA , HAITI , HONDURAS , HONG KONG SAR, CHINA , HUNGARY , ICELAND , INDIA , INDONESIA , IRAN, ISLAMIC REP. , IRAQ , IRELAND , ISRAEL , ITALY , JAMAICA , JAPAN , JERSEY, CHANNEL ISLANDS , JORDAN , KAZAKHSTAN , KENYA , KIRIBATI , KOREA, DEM. REP. , KOREA, REP. , KOSOVO , KUWAIT , KYRGYZ REPUBLIC , LAO PDR , LATVIA , LEBANON , LESOTHO , LIBERIA , LIBYA , LIECHTENSTEIN , LITHUANIA , LUXEMBOURG , MACAO SAR, CHINA , MACEDONIA, FYR , MADAGASCAR , MALAWI , MALAYSIA , MALDIVES , MALI , MALTA , MARSHALL ISLANDS , MARTINIQUE , MAURITANIA , MAURITIUS , MEXICO , MICRONESIA, FED. STS. , MOLDOVA , MONACO , MONGOLIA , MONTENEGRO , MOROCCO , MOZAMBIQUE , MYANMAR , NAMIBIA , NAURU , NEPAL , NETHERLANDS , NETHERLANDS ANTILLES (FORMER) , NEW CALEDONIA , NEW ZEALAND , NICARAGUA , NIGER , NIGERIA , NIUE , NORWAY , OMAN , PAKISTAN , PALAU , PANAMA , PAPUA NEW GUINEA , PARAGUAY , PERU , PHILIPPINES , POLAND , PORTUGAL , PUERTO RICO , QATAR , RÉUNION , ROMANIA , RUSSIAN FEDERATION , RWANDA , SAMOA , SAN MARINO , SÃO TOMÉ AND PRINCIPE , SAUDI ARABIA , SENEGAL , SERBIA , SEYCHELLES , SIERRA LEONE , SINGAPORE , SLOVAK REPUBLIC , SLOVENIA , SOLOMON ISLANDS , SOMALIA , SOUTH AFRICA , SOUTH SUDAN , SPAIN , SRI LANKA , ST. KITTS AND NEVIS , ST. LUCIA , ST. VINCENT AND THE GRENADINES , SUDAN , SURINAME , SWAZILAND , SWEDEN , SWITZERLAND , SYRIAN ARAB REPUBLIC , TAIWAN, CHINA , TAJIKISTAN , TANZANIA , THAILAND , TIMOR-LESTE , TOGO , TONGA , TRINIDAD AND TOBAGO , TUNISIA , TURKEY , TURKMENISTAN , TUVALU , UGANDA , UKRAINE , UNITED ARAB EMIRATES , UNITED KINGDOM , UNITED STATES , URUGUAY , UZBEKISTAN , VANUATU, VENEZUELA, RB , VIETNAM , VIRGIN ISLANDS (U.S.) , WEST BANK AND GAZA , YEMEN, REP. , ZAMBIA , ZIMBABWE

3 See Link

RE:”Restrictive regulation is positively correlated with corruption”

With regard to Jeff’s post here.

The data source is here.

Jeff quotes Mandani’s blog claim:

The World Bank’s Investment Climate Department (CIC) has reviewed the recent literature on the relationship between restrictive regulation, corruption and business environment reforms, finding that corruption is positively correlated with restrictive regulation.

Jeff disagrees with Mandani. Here is Jeff’s hypothesis

Correlation does not imply causation. When two events A and B are correlated, one of the following is true:

1. A caused B

2. B caused A

3. Some third factor C caused both A and B

4. A and B happening together are just a coincidence.

The correlation appears significant enough that #4 is unlikely.

It also seems unlikely that the length of time it takes to start a business would cause corruption. Correct me if I’m wrong here.

That leaves either #1 or #3.

I hereby hypothesize that #3 is the culprit, and further that factor C is the power brokering-rich environment resulting from a too-large government.

Jeff thinks that the other factor is “too-large government” which results in a “power brokering-rich environment”. I suppose this means that if the government is too large, corporations will use the government to create regulation to benefit themselves and therefore, result in corruption. I take it that Jeff’s solution would mean a small government which would, in theory, keep large corporations from getting corrupt regulations that benefit themselves. Additionally, in true Austrian School economics fashion, if the government is small the free-market will work more efficient over time and, I assume the conclusion would be, result in less corruption in the system (and certainly in less booms and busts according to Austrian economics). If this is the case, the problem with the purity of the Austrian utopian dream is that this data does not back up that claim. To the contrary, this data counters that claim.

Here is my hypothesis:

Jeff is right with regard to #3 being the culprit. However, Jeff is wrong about the specific other factor (C).

First, I have graphed all the data that the World Bank has accumulated based on their 2011 data, the latest data they provide. You can download their data with my added graphed sheets here. They have 5 benchmarks that they measure for 215 countries:

Political Stability, Government Effectiveness, Regulatory Quality, Control of Corruption, Voice and Accountability

Each of the benchmarks are defined above the graphs and the definitions can be found here.

Each benchmark spans the approximate range from -2.5 to +2.5. Estimates range from approximately -2.5 (weak) to 2.5 (strong).

Each graph shows the data sorted by one benchmark, one column only, from lowest value to highest value. The other benchmarks on the graph falls where they may. We will call the sorted column benchmark the dependent variable as it is the outcome we are comparing to our non-sorted benchmarks, the independent variables. The sorted benchmark for each graph is shown as the thickest line on each graph. Linear trend lines are displayed for each of the other, non-sorted, benchmarks for each graph. This methodology will show the relationship of the other independent variable benchmarks, to the dependent variable, the sorted benchmark, to determine which of the independent variable benchmarks might have a causal relationship to the sorted, dependent variable benchmark. We will also look for any relationships we can see of the benchmarks to each other. Also, we should try to see if Jeff’s hypothesis concerning “too-large government” shows a pattern in any of the dependent variables tested.

What the data shows:

If each of the benchmarks are sorted from low to high, the other non-sorted benchmarks trend lines linearly follow the sorted benchmark upwards. This would indicate that each of the benchmarks play a role in improving the results of the others or, put another way, there is no necessary cause and effect relation established by this data to only one or only some of the independent variable benchmarks to the dependent variable benchmark. All of the independent variable benchmarks appear to effect the dependent variable benchmark causally. For example, less corruption results when improvements are made in political stability, government effectiveness, and voice and accountability and not just regulatory quality. The “Control of Corruption” graph shows that the “Regulatory Quality”, independent variable is not a factor of regulationper se but of political stability, government effectiveness, regulatory quality, control of corruption, voice and accountability. In fact, there is nothing in the data about ‘regulation’ as too much or too little regulation but ‘regulation quality’. Additionally, this data does not add credence to the Austrian School’s claim that the free market is able to regulate itself (if that is indeed the claim of the purist fundamentalists). Neither does this data show any singular correlation to the “restrictiveness” of regulations (“regulation quality”) to corruption. If it did, some (perhaps one could argue some but not all of the benchmarks are overlapping to “regulation quality”) or all of the other benchmark trend lines would not have a positive slope. For example, if political stability is decreased, it seems to indicate that corruption goes up as well. There does not appear to be a singular benchmark that is independent from the others with regard to government corruption (“Control of Corruption”).

Additionally, if you look at the countries that are doing better (closer to 2.5) you will see no correlation between big and small countries or governments. This would seem to indicate the Jeff’s hypothesis is wrong with regard to the absolute or relative size of the government. Since all the countries will not fit on the horizontal axis without making the graph too big I will list where the United States rank is for each benchmark (N/As are not included) and the countries that are ahead of us (closer to 2.5):

Political Stability 136 out of 213

CYPRUS, MONGOLIA, CHILE, ITALY, ESTONIA, MACAO SAR, CHINA, COSTA RICA, FRANCE, OMAN, LITHUANIA, PUERTO RICO, MARTINIQUE, PORTUGAL, CAPE VERDE, HUNGARY, GUAM, SLOVENIA, SAMOA, GERMANY, BHUTAN, AUSTRALIA, ST. LUCIA, ST. VINCENT AND THE GRENADINES, MAURITIUS, BELGIUM, NAMIBIA, TAIWAN, CHINA, URUGUAY, UNITED ARAB EMIRATES, HONG KONG SAR, CHINA, SLOVAK REPUBLIC, TONGA, JAPAN, SEYCHELLES, AMERICAN SAMOA, ANTIGUA AND BARBUDA, VIRGIN ISLANDS (U.S.), MALTA, BERMUDA, IRELAND, MONACO, NAURU, PALAU, SAN MARINO, BOTSWANA, CANADA, POLAND, ST. KITTS AND NEVIS, DENMARK, CZECH REPUBLIC, BAHAMAS, THE, BRUNEI DARUSSALAM, NETHERLANDS, VANUATU, AUSTRIA, SINGAPORE, QATAR, ICELAND, DOMINICA, MICRONESIA, FED. STS., SWEDEN, SWITZERLAND, BARBADOS, NETHERLANDS ANTILLES (FORMER), ARUBA, LUXEMBOURG, ANDORRA, KIRIBATI, TUVALU, NORWAY, NEW ZEALAND, FINLAND, CAYMAN ISLANDS, JERSEY, CHANNEL ISLANDS, LIECHTENSTEIN, ANGUILLA, GREENLAND

Government Effectiveness 188 out of 212

IRELAND, JERSEY, CHANNEL ISLANDS, BARBADOS, ANDORRA, ANGUILLA, CYPRUS, GERMANY, UNITED KINGDOM, ICELAND, AUSTRIA, BELGIUM, HONG KONG SAR, CHINA, LUXEMBOURG, AUSTRALIA, LIECHTENSTEIN, NORWAY, NETHERLANDS, CANADA, SWITZERLAND, NEW ZEALAND, SWEDEN, SINGAPORE, DENMARK, FINLAND

Regulatory Quality 195 out of 212

LIECHTENSTEIN, GERMANY, CHILE, ANDORRA, UNITED KINGDOM, SWITZERLAND, IRELAND, CANADA, FINLAND, AUSTRALIA, SINGAPORE, SWEDEN, NETHERLANDS, LUXEMBOURG, HONG KONG SAR, CHINA, NEW ZEALAND, DENMARK

Control of Corruption 182 out of 212

URUGUAY, ANTIGUA AND BARBUDA, BERMUDA, ANGUILLA, ANDORRA, CAYMAN ISLANDS, BAHAMAS, THE, AUSTRIA, IRELAND, JAPAN, FRANCE, UNITED KINGDOM, CHILE, BELGIUM, GERMANY, BARBADOS, LIECHTENSTEIN, HONG KONG SAR, CHINA, ICELAND, CANADA, SWITZERLAND, SINGAPORE, AUSTRALIA, NORWAY, NETHERLANDS, LUXEMBOURG, FINLAND, SWEDEN, NEW ZEALAND, DENMARK

Voice and Accountability 184 out of 214

ST. VINCENT AND THE GRENADINES, MARSHALL ISLANDS, SAN MARINO, ST. KITTS AND NEVIS, PALAU, FRANCE, BARBADOS, ST. LUCIA, JERSEY, CHANNEL ISLANDS, GREENLAND, ARUBA, RÉUNION, UNITED KINGDOM, GERMANY, IRELAND, ANDORRA, BELGIUM, AUSTRIA, CANADA, AUSTRALIA, ICELAND, NETHERLANDS, NEW ZEALAND, FINLAND, LIECHTENSTEIN, LUXEMBOURG, SWEDEN, DENMARK, NORWAY, SWITZERLAND

A few of my comments:

There are multiple reasons for corruption and it is way too simplistic to blame it on ‘regulation’ (in regard to more or less) alone. It may be fair to suggest that ‘bad’ or ineffective regulation could be one factor in increasing corruption but the data does not independently verify this to be the only factor. We should look at how the World Bank defines corruption:

Control of corruption captures perceptions of the extent to which public power is exercised for private gain, including both petty and grand forms of corruption, as well as “capture” of the state by elites and private interests.

Corporatism = Corruption

Their definition is probably the definition of corporatism (see my related essay on corporatism). By definition, corporatism is corruption. In this case, corporatism and corruption is effectively a tautology. However, the definition does not prove the case, the data does.

Corporatism does not necessarily lead to corruption if you believe the Supreme Court of the United States

This data cannot be contrived to make the claim that regulatory quality alone leads to corruption (or its effective tautological definition in this case – corporatism). It is possible to think that “corporations are people too” and they may actually have the best interest of their communities in addition to the best interest of their bottom line (as the ‘clean coal’ campaign would have us believe1).

Regulation as defined by ‘restricting effectiveness’ does not have to be done by the government and many times is not done by the government

If the free market is to decide there will be large corporations and small businesses. Large corporations can effectively ‘regulate’ the market with or without the government as I have made the case elsewhere. The contention of the Austrians is that this type of private ‘free market regulation’ can be overcome by competition. This may or may not be the case. I would think some of the other benchmarks cited here like “Voice and Accountability” might have an impact on this but this is not demonstrated by the data. Additionally, very large multi-national corporations can effectively evade many regulations and taxes of any particular government by locating their operations in more ‘regulatory or tax friendly’ countries and thus create competitive advantages that would be difficult to overcome in the ‘real’ world.

What this data does not show

This data does not show how regulation may actually reduce corruption (i.e., vis-à-vis conflict of interest banking regulations, bribery, loan sharking and theft laws, abolishing slavery, outlawing child labor, ruining the environment, aircraft maintenance, lead based toys, etc.). If, by definition, public regulation is corrosive and the private market cannot be corrosive to market economies, we may have Austrian ideological purity but restraint of corruption is another issue altogether.

With these points in mind, I personally would conclude that corporatism may lead to corruption but that is not substantiated by this data, by the Supreme Court, by the Republican Party, by public policy alone (without ‘free market’, self-regulation also restricting effectiveness). It is also not apparent by this data that corruption may actually be restricted by public policy.

There are countries2 with much smaller and larger governments that are doing better than the United States regarding the benchmarks relative to their size and government spending versus GDP. If you will notice on the “Control of corruption” benchmark there are countries doing better than us like the “government controlled” health care countries of Canada, United Kingdom and France, the “Euro-Socialists”, and even the king of government bureaucracies, communist China (Hong Kong). I believe China is doing better on all the benchmarks except “Voice and Accountability” than the United States in addition to many of the “Euro-Socialists” and the government controlled health care countries. In my opinion, this disproves Jeff’s hypothesis that corruption (as defined by corporatism) is caused by the size of government vis-à-vis public policy regulation.

What we should all learn:

If an ideology makes short shrift of data in order to validate itself, the ideology functions like a religious dogma not like a falsifiable scientific claim. To the degree that we help each other become more rational (I include myself most of all) is to the same degree that we will have a real and positive effect on our community and help each other become better critical thinkers.

——————————————————————-

What is “governance” according to the World Bank?3

Governance consists of the traditions and institutions by which authority in a country is exercised. This includes the process by which governments are selected, monitored and replaced; the capacity of the government to effectively formulate and implement sound policies; and the respect of citizens and the state for the institutions that govern economic and social interactions among them.

World Bank Data Graphed

Political Stability – Political stability and absence of violence measures perceptions of the likelihood that the government will be destabilized or overthrown by unconstitutional or violent means, including politically-motivated violence and terrorism.

Government Effectiveness – Government effectiveness captures perceptions of the quality of public services, the quality of the civil service and the degree of its independence from political pressures, the quality of policy formulation and implementation, and the credibility of the government’s commitment to such policies.

Regulatory Quality – Regulatory quality captures perceptions of the ability of the government to formulate and implement sound policies and regulations that permit and promote private sector development.

Rule of Law – Rule of law captures perceptions of the extent to which agents have confidence in and abide by the rules of society, and in particular the quality of contract enforcement, property rights, the police, and the courts, as well as the likelihood of crime and violence.

Control of Corruption – Control of corruption captures perceptions of the extent to which public power is exercised for private gain, including both petty and grand forms of corruption, as well as “capture” of the state by elites and private interests.

Voice and Accountability – Voice and accountability captures perceptions of the extent to which a country’s citizens are able to participate in selecting their government, as well as freedom of expression, freedom of association, and a free media.

_________________

1 From the Republican Party Platform adopted in the 2012 convention (Link pdf):


A Failed National Security Strategy

The current Administration’s most recent National

Security Strategy reflects the extreme elements

in its liberal domestic coalition.

Finally, the strategy subordinates our national

security interests to environmental, energy, and

international health issues, and elevates “climate

change” to the level of a “severe threat” equivalent to

foreign aggression. The word “climate,” in fact, appears

in the current President’s strategy more often

than Al Qaeda, nuclear proliferation, radical Islam,

or weapons of mass destruction.

One word – SANDY

2 This is a list of all the countries used to compile the data (Link):

AFGHANISTAN , ALBANIA , ALGERIA , AMERICAN SAMOA , ANDORRA , ANGOLA , ANGUILLA , ANTIGUA AND BARBUDA , ARGENTINA , ARMENIA , ARUBA , AUSTRALIA , AUSTRIA , AZERBAIJAN , BAHAMAS, THE , BAHRAIN , BANGLADESH , BARBADOS , BELARUS , BELGIUM , BELIZE , BENIN , BERMUDA , BHUTAN , BOLIVIA , BOSNIA AND HERZEGOVINA , BOTSWANA , BRAZIL , BRUNEI DARUSSALAM , BULGARIA , BURKINA FASO , BURUNDI , CAMBODIA , CAMEROON , CANADA , CAPE VERDE , CAYMAN ISLANDS , CENTRAL AFRICAN REPUBLIC , CHAD , CHILE , CHINA , COLOMBIA , COMOROS , CONGO, DEM. REP. , CONGO, REP. , COOK ISLANDS , COSTA RICA , CÔTE D’IVOIRE , CROATIA , CUBA , CYPRUS , CZECH REPUBLIC , DENMARK , DJIBOUTI , DOMINICA , DOMINICAN REPUBLIC , ECUADOR , EGYPT, ARAB REP. , EL SALVADOR , EQUATORIAL GUINEA , ERITREA , ESTONIA , ETHIOPIA , FIJI , FINLAND , FRANCE , FRENCH GUIANA , GABON , GAMBIA, THE , GEORGIA , GERMANY , GHANA , GREECE , GREENLAND , GRENADA , GUAM , GUATEMALA , GUINEA , GUINEA-BISSAU , GUYANA , HAITI , HONDURAS , HONG KONG SAR, CHINA , HUNGARY , ICELAND , INDIA , INDONESIA , IRAN, ISLAMIC REP. , IRAQ , IRELAND , ISRAEL , ITALY , JAMAICA , JAPAN , JERSEY, CHANNEL ISLANDS , JORDAN , KAZAKHSTAN , KENYA , KIRIBATI , KOREA, DEM. REP. , KOREA, REP. , KOSOVO , KUWAIT , KYRGYZ REPUBLIC , LAO PDR , LATVIA , LEBANON , LESOTHO , LIBERIA , LIBYA , LIECHTENSTEIN , LITHUANIA , LUXEMBOURG , MACAO SAR, CHINA , MACEDONIA, FYR , MADAGASCAR , MALAWI , MALAYSIA , MALDIVES , MALI , MALTA , MARSHALL ISLANDS , MARTINIQUE , MAURITANIA , MAURITIUS , MEXICO , MICRONESIA, FED. STS. , MOLDOVA , MONACO , MONGOLIA , MONTENEGRO , MOROCCO , MOZAMBIQUE , MYANMAR , NAMIBIA , NAURU , NEPAL , NETHERLANDS , NETHERLANDS ANTILLES (FORMER) , NEW CALEDONIA , NEW ZEALAND , NICARAGUA , NIGER , NIGERIA , NIUE , NORWAY , OMAN , PAKISTAN , PALAU , PANAMA , PAPUA NEW GUINEA , PARAGUAY , PERU , PHILIPPINES , POLAND , PORTUGAL , PUERTO RICO , QATAR , RÉUNION , ROMANIA , RUSSIAN FEDERATION , RWANDA , SAMOA , SAN MARINO , SÃO TOMÉ AND PRINCIPE , SAUDI ARABIA , SENEGAL , SERBIA , SEYCHELLES , SIERRA LEONE , SINGAPORE , SLOVAK REPUBLIC , SLOVENIA , SOLOMON ISLANDS , SOMALIA , SOUTH AFRICA , SOUTH SUDAN , SPAIN , SRI LANKA , ST. KITTS AND NEVIS , ST. LUCIA , ST. VINCENT AND THE GRENADINES , SUDAN , SURINAME , SWAZILAND , SWEDEN , SWITZERLAND , SYRIAN ARAB REPUBLIC , TAIWAN, CHINA , TAJIKISTAN , TANZANIA , THAILAND , TIMOR-LESTE , TOGO , TONGA , TRINIDAD AND TOBAGO , TUNISIA , TURKEY , TURKMENISTAN , TUVALU , UGANDA , UKRAINE , UNITED ARAB EMIRATES , UNITED KINGDOM , UNITED STATES , URUGUAY , UZBEKISTAN , VANUATU, VENEZUELA, RB , VIETNAM , VIRGIN ISLANDS (U.S.) , WEST BANK AND GAZA , YEMEN, REP. , ZAMBIA , ZIMBABWE

3 See Link

A comment on my math…

Here is a comment from this article which I wrote.

Here is my response…


Juan,

Thank you very much for your comment. I always love it when I see rationality! I am sincere in wanting to understand this issue aside from the tongue-in-check way this was written.

I assume you meant “5 trillion over 10 years” (hate it when I can’t edit).

I was going off the Tax Policy Center study which made the following findings…


“Relative to a current policy baseline, the reduction in liability would be about $480 billion in calendar year 2015.” http://www.taxpolicycenter.org/taxtopics/Romney-plan.cfm


The Tax Policy Center is a joint venture of the Urban Institute and the Brookings Institute so I assume this is the study you are referring to. I find the Tax Policy Center to really be non-partisan since Republicans regularly refer to it and also suggest that it is non-partisan. However, I know the Romney campaign did not agree with their numbers on this. 480 billion dollars is 4.8 trillion in 10 years which is where the rounded 5 trillion dollar number came from.

If this is supposed to be from the report…


” The reduction in tax revenue from a 20% cut in tax rates is projected to be around $360 billion per year in 2015 or $3.6 trillion over 10 years. ”


then I think it may be wrong. If it is from another report, please let me know where to find it.

In addition, when you write…


” The Brookings report comes up with a much higher figure by counting the upcoming tax increases contained in Obamacare’s new surtaxes on investment and wage income on high-income earners.

The assumption is that Romney would repeal Obamacare and these tax increases will not go into affect.

It does not make sense since to include the repeal of a tax increase as a tax cut since the expenses associated with Obamacare will also not go into effect if it is repealed.

Also the only difference between Romney and Obama regarding the Bush tax cuts is Romney wants them to be permanent for everyone and Obama wants to repeal them for income > 250k. The loss in revenue from repealing the Bush tax rates for income >$250k is $89 billion.”


I see the Affordable Care Act (ACA) and letting the Bush tax cuts expire for the wealthy (>$250,000) as two separate things. Even if the ACA is not repealed, the Bush tax cuts for those making over 250K could go a few percentage points up to the Clinton administration rates if the Bush tax cuts are allowed to expire for them.

The 5.4 trillion dollars that I quoted is if ALL the Bush tax cuts expire according to the CBO. The 89 billion dollars you are using is only for those over 250K/year. It may be right but I would like to know where you got that number.

From the 2012 CBO report, Table I-6, cell P59, you will see the 10 year projection of 5.422 billion dollars of revenue that the Federal Government would have had if we let ALL the Bush tax cuts expire and go back to the way it was during the Clinton years. Here is the alternative fiscal scenario…

” Notes: The alternative fiscal scenario incorporates the assumptions that all expiring tax provisions (other than the payroll tax reduction), including those that expired at the end of December 2011, are instead extended; that the alternative minimum tax is indexed for inflation after 2011 (starting at the 2011 exemption amount); that Medicare’s payment rates for physicians’ services are held constant at their current level; and that the automatic enforcement procedures specified by the Budget Control Act of 2011 do not take effect. Outlays under the alternative fiscal scenario also include the incremental interest costs associated with projected additional borrowing.” http://cbo.gov/publication/43543

As you can see there are some other conditions on this besides letting the Bush tax cuts expire. These additional items are not current laws but ones that have either received Republican only support in congress or mixed Democrat and Republican support. Namely, there is:

Indexing the alternative minimum tax for inflation which reduces revenue for the Fed

Medicare payment to physicians does not increase (as many Republicans and Dems have proposed that we do). This is not a part of ACA. It is a separate bill (I can give you the house bill number if you need it – not sure if it ever got to the Senate). Paying Medicare physicians more would reduce revenue but arguments are made that without it, the elderly are going to have a harder time finding physicians that will take Medicare – not sure about that one)

We do not hit the fiscal cliff. If we do hit it, we sill severely cut spending for the Fed which will help the deficit but the experts I have read tell me that it will put the economy in a tail spin and a severe recession will take revenue away from the Fed (as it has with the Bush recession).

The interest payment s from the overall decreased revenues will hit the deficit and the national debt to the tune of 5.422 trillion dollars and accordingly, the interest we pay on the debt will go up.

By far, the most hit on the revenue side is from extending the Bush tax cuts for everyone. The Republicans and Romney have repeatedly stated that they will do this. Therefore, the 5.4 trillion dollars that I quoted for extending the Bush tax cuts is accurate.

Please note that the largest increase to the debt came from ALL the Bush tax cuts (https://www.mixermuse.com/blog/2012/07/17/myths-exposed-president-obama-is-responsible-for-historic-u-s-federal-debt-and-spending-levels-2/) estimated at the Center on Budget and Policy Priorities at 1.812 trillion dollars during the Bush administration. Since the rationale of the Bush tax cuts were to boost the economy and the economy went into the deepest recession since the Great Depression, I think the underlying ideology needs to be questioned (i.e., that tax cuts stimulate growth). The Bush tax cuts were bad economic policy then and still are – they did not grow the economy. In general, I think the Republican ideology espoused by Bush and now by Romney is BAD economics, failed the recent historical test, and boggles my mind how regular folk think it might work if we try it again…change can be for the worse not necessarily the better…it will not hurt me if the economy tanks but the very people that want to try it again may be bit by the overused axiom “be careful what you ask for because you may get it”.

When you state this…

” The total cost of all tax exemptions, credits, etc. is around $1.1 trillion in 2011. This is also from the White House Fiscal Year 2013 budget proposal.”

are you suggesting that all exemptions from 2011 are included in the White House 2013 budget? Here is the budget – http://www.whitehouse.gov/omb/budget/Overview/ I did not find any 2011 numbers in it. I also checked many of the 40 or 50 spreadsheets for the budget and found no detail in it about “all tax exemptions” amounting to $1.1 trillion dollars. Please let know precisely where I can get that information in the 2013 budget.

You also state that…

” Some economists have projected that the increased economic growth from a 20% tax cut could increase tax revenue from $25 to $58 billion per year.”

I would like to see links to these specific economists. What I do know is that during the Clinton years, before the Bush tax cuts, the economy was growing like crazy and after the Bush tax cuts the economy shrank like crazy (the recession that started in 2008 before Jan. 20, 2009 when President Obama took office). This would indicate that there is more to growing the economy that just cutting taxes. I have looked at various economist’s historical records that also indicate there is no correlation between tax cuts and economic growth.

The total number for the top twelve deductions that I listed come from the Tax Policy Center (http://www.taxpolicycenter.org/briefing-book/background/expenditures/largest.cfm) which, as I have stated before, is regularly used by both Republicans and Democrats so I am hanging with that unless you can give a specific source.

In conclusion, I have found over the years that political rhetoric needs to be constantly fact checked with non-partisan, solid sources. The rule seems to be that ‘facts’ float around that most folks never get into the weeds over…and generally the ‘facts’ on both sides of the isle are wrong.

I really am not so committed to an ideology that facts will not make a difference…with real, solid facts I will and have taken stands against Democrats and Republicans.

Thanks for caring and responding…

Mark

The Wealth Calculation

As a small business owner I have been trying to think through the rationale the Republican Party uses to sincerely make the claim that President Obama is raising taxes on small business. I understand the idea that limited liability corporations and S-Corps ‘net’ gain is taxable as personal income to the owner. Therefore, if a small business owner makes over $250,000/year in personal income and the Bush tax cuts for the wealthy are allowed to expire, paying the same taxes they did in the Clinton years, they will be paying a slightly higher rate in taxes.

With that in mind, let’s clarify another point. Whether you are a big corporation or a small business the general idea of taxes is that your net gain is what is taxed. For larger corporations, their taxable gains are ‘net’ and taxed with the corporate tax rate. If they expand the corporation or buy new companies, that is a tax write off for them. The taxes they pay are calculated by subtracting their profits from their losses to come up with the ‘net’ gain that is taxed with the corporate rate. This is how a company like General Electric can get away with paying no income taxes. No matter what the corporate tax rate is, if you effectively pay no taxes because you ‘create jobs’, zero is still zero. The difference is that the tax code gives you incentive to create jobs as opposed to letting the cash sit in a corporate account somewhere. The executives and owners of the company (even if they are merely investors) are paid as personal salary or capital gains (capital gains is still ‘net’ – after market losses). If they make over $250,000/year, letting the Bush tax cuts expire will give them more money to decide what to do with. This decision will effectively be the same calculation as discussed below for the small business owner.

If you are a small company and the owner makes 5 million dollars a year in income, the owner can decide to pocket that money and pay more taxes, in this case on the 4.75 million dollars if the Bush tax cuts expire, over $250,000/year. However, if the owner decides to put 4 million dollars into ‘creating new jobs’ he will either start a new business or add more positions to the business he already owns. The expense of creating a new business, employees salaries, capital equipment is all a loss (or deductible) on a profit and loss statement. Therefore, the owners ‘net’ gain is the offset of gains and losses. The effect of this is to reduce the ‘net gain’ of the small business owner and therefore to reduce the amount of taxes the business owner has to pay over $250,000/year. If the small business owner is a “job creator” then this necessarily implies that the creation of jobs is a tax write off for him or her. Effectively, this is the same as the “zero is still zero” concept for large corporations. If the small business owner decides to pocket that money and invest it, even if he or she loses money in the market on investments, that also can reduce the ‘net’ capital gains that are taxed. The only way that more taxes are incurred by the owner in letting the Bush tax cuts expire on the wealthy is if the owner takes the whole gain as ‘net’ gain…basically puts the money into savings or consumables. Therefore, if the small business owner is truly creating jobs then they save on the taxes they would otherwise have paid by simply pocketing the money. For wealthy folks, this calculation is an incentive to reinvest their money especially since they probably already have all the cash (savings and retirement), houses and cars (consumables) they need for the rest of their lives. Therefore, the incentive of reducing their taxes by not letting the Bush tax cuts expire is not to reinvest but to stuff more cash into their already bloated mattress (or to get to non-taxable foreign accounts).

Here is the rub…I am assuming that the smart, business Republicans already understand this concept since, as rich folks, they make these calculations all the time. I also know that all the money, time and expense they put into getting folks that are not needing to make ‘the calculation’ and do not understand the tax incentives for wealthy folks to create jobs is an expense for the wealthy. Therefore, if you take the money they put into getting their ‘wealth-friendly’ politicians in office as an expense versus the small amount of extra money that they would have to pay if the Bush tax cuts expire, the incentive (or net gain after the ‘political’ expenses) must be proportionally MUCH larger than simply biting the bullet and paying the extra taxes on their ‘personal’ (mattress stuffing money) income. First, this gives you an idea of how much opulence and luxury they really enjoy. Second, the ‘political’ expense is purely for manipulating those Republicans that are not as ‘calculating’ as themselves. Third, the old stereotype of rich pig-ish-ness (or better priggishness) is actually more true than I thought it was.


Please Correct My Math


I know that I am not an economist but I did study math in Electrical Engineering and I did use math during decades of engineering work and my wife retired from the GAO as an auditor but our math is not adding up with regard to Romney’s tax and budget ideas. Here is the problem:


Romney has stated that he will make the Bush tax cuts permanent. The CBO estimates that this will cost the Federal Government 5.4 trillion dollars over 10 years (link).

Additionally, Romney states that he will cut 20% more across the board in all federal income tax rates, eliminating the Alternative Minimum Tax, eliminating the estate tax, reducing the corporate income tax rate and other tax reductions. This will cost another 5 trillion dollars in 10 years (link).

Romney has also said that he would increase defense spending by 2 trillion dollars over 10 years (link).

If you add all these numbers up you will get 12.4 trillion dollars in increased spending or revenue cuts over 10 years. The works out to about 1.24 trillion dollars a year.

Romney has stated that his cuts and spending will be deficit neutral. He plans to make up the difference by eliminating tax loopholes or deductions. If this is to be deficit neutral he will have to make up 1.24 trillion dollars a year by eliminating loopholes and deductions.


Here are the largest loopholes and deductions in the tax code.

link


The top 10 make up 70% of all tax deductions (link).

All 12 of these deductions amount to 653.7 billion dollars a year.

Therefore, we are still lacking 583.6 billion dollars a year to be deficit neutral after all 12 deductions are eliminated.

Romney has stated that he would cap the deductions at $17,000, $25,000, $50,000 or “make up a number” a year in order to be deficit neutral.


My questions are:

1) With all the tax deductions intact, where is the 1.24 trillion dollars a year going to come from if the deficit is not increased? The CBO estimates that the Federal Government’s FY2012 deficit is 1.1 trillion dollars (link). We would have to either eliminate ALL spending by the Federal Government (and we would still be short 140 billion dollars) or greatly increase taxes or some combination of both. How would this affect economic growth? How will this affect the cost of living?

2) If the deductions are capped at any of Romney’s made up numbers, this will add more money to government coffers to pay down the deficit. Even if the ‘made up number’ for maximum deductions allowed is zero because all the above tax deductions are eliminated, it will only add 653.7 billion dollars a year to Federal Government coffers. This still leaves 583.6 billion dollars a year that will need to be made up to be deficit neutral. How will this translate to a lower the cost of living? How could this not result in a huge, effective tax increase?

3) Additionally, if all the above deductions were eliminated then employers are paying more in taxes for health care, employees are paying more in taxes for pension contributions, homeowners are paying more in taxes to own a home and taxes to buy a home, employers are paying more for capital expenditures, tax payers are paying more for not getting breaks on state and local taxes, tax payers get no break from charitable contributions, foreign corporations are paying more taxes, capital gains are taxed more and folks with kids are paying more. How is this going to translate to a lower cost of living? How could this not result in a huge, effective tax increase?

4) If the 20%, across the board number goes away and no deductions are eliminated, there is still 7.4 trillion dollars for 10 years or 740 billion dollars a year that needs to be made up to be deficit neutral. Where will all this money come from? How will this not result in a huge, effective tax increase?

5) If the 20%, across the board number goes away and the Bush tax cuts are not extended and no deductions are eliminated, there is still 2 trillion dollars for 10 years or 200 billion dollars a year that needs to be made up to be deficit neutral. Where will all this money come from? Taxes will be increased with the Bush tax cuts going away.

6) If the 20%, across the board number goes away and the Bush tax cuts are not extended and the increased defense spending goes away and all above deductions are eliminated then that would pay off the deficit by 653.7 billion dollars a year. However, point 3 still applies, the cost of living goes up, taxes are increased with the Bush tax cuts going away and it makes Mitt Romney a liar.


Conclusion

Since I know that Romney could not lie or change his position, I can only conclude that my math is wrong.

Since I also know that an economist with superior math skills would not read such a lowly post as mine, I would ask that any regular ‘ol, internet hack like myself give me a few pointers about how I can improve my math (even smart ass comments will be treated with all due sincerity ;-).


————————————–


Notes and References:

CBO 5.4 trillion over 10 years for the Bush tax cuts link

Romney additional 20% across the board, reduce corporate income tax rate to 25%

Romney add 2 trillion over 10 years to defense spending

“Make up a number, $25,000, $50,000. Anybody can have deductions up to that amount,” he said. link

“The 10 biggest personal tax expenditures, which together account for 70 percent of all personal tax breaks, are as follows: the exclusion of employer health insurance, the exclusion of employer pensions, the mortgage interest deduction, the exclusion of medicare, lower capital gains rates, the earned income tax credit, the deduction of income taxes, the exclusion of capital gains taxes at death, the deduction of charitable contributions, and the deduction of employer benefits under cafeteria health plans.” link

“Governor Romney’s central economic plan calls for a $5 trillion tax cut — on top of the extension of the Bush tax cuts — that’s another trillion dollars” –President Obama

“”I don’t have a $5 trillion tax cut” –Governor Romney

How can both facts be true? The $5 trillion figure comes from the fact that Romney has proposed to cut tax rates by 20 percent and eliminate the estate tax and alternative minimum tax. The nonpartisan Tax Policy Center says that would reduce tax revenue by nearly $500 billion in 2015, or about $5 trillion over 10 years

But Romney also has said he will make his plan “revenue neutral” by eliminating tax loopholes and deductions, although he has not provided the details.

The Tax Policy Center has analyzed the specifics of Romney’s plan thus far released and concluded the numbers aren’t there to make it revenue neutral.” link

“Romney lays out his national security policy on his website. There, he warns that restoring the military “will not be a cost-free process,” and says he will “begin by reversing Obama-era defense cuts … with the goal of setting core defense spending — meaning funds devoted to the fundamental military components of personnel, operations and maintenance, procurement, and research and development — at a floor of 4 percent of GDP.”

What’s 4 percent worth?

The Pentagon’s budget is expected to run in the range of 3.2 to 3.5 percent of GDP in the next fiscal year. According to the Center for a New American Security, a group with ties to both Republican and Democratic administrations, even a gradual ramp up to 4 percent would increase defense spending by $2.1 trillion over the next ten years, as reported by CNN.

The Committee for a Responsible Federal Budget, a bipartisan group focused on deficit reduction, uses that number too, as do other budget think tanks. Romney seems to accept it, so as far as the $2 trillion figure goes, it seems reasonably accurate.” link

“The claim is based on a study done by the Tax Policy Center, a nonpartisan group that has analyzed the tax plans of the candidates. The center examined Romney’s proposals for a 20 percent reduction in all federal income tax rates, eliminating the Alternative Minimum Tax, eliminating the estate tax and other tax reductions.

The center estimated that altogether, the lost revenues would total $480 billion by 2015. The Obama campaign adds up the cost over a decade and winds up with $4.8 trillion, which it then rounds up to $5 trillion.

The most Romney has personally said is that he might cap deductions at $17,000″ link

“Reduce federal spending as a share of GDP to 20 percent – its pre-crisis average – by 2016.

Reduce individual marginal income tax rates across-the-board by 20 percent, while keeping current low tax rates on dividends and capital gains. Reduce the corporate income tax rate – the highest in the world – to 25 percent.

Broaden the tax base to ensure that tax reform is revenue-neutral.

Gradually reduce growth in Social Security and Medicare benefits for more affluent seniors. Give more choice in Medicare to improve value in health care spending.

Block grant the Medicaid program to states, enabling experimentation to better fit local situations.

Remove regulatory impediments to energy production and innovation that raise costs to consumers and limit job creation.

Repeal and replace the Dodd-Frank Act and the Patient Protection and Affordable Care Act. The Romney alternatives will emphasize better financial regulation and market-oriented, patient-centered health care reform.

Tax Reform.

A significant body of economic research concludes that fundamental tax reform could increase real GDP growth over the next decade by 0.5 to 1 percentage point per year. Kevin Hassett and Alan Auerbach surveyed the literature and found that tax reform could increase output by between 5 and 10 percent. (Auerbach, J., Alan, Kevin A. Hassett, Toward Fundamental Tax Reform, Washington, D.C.: The AEI Press, 2005). David Altig, AlanAuerbach, Laurence Kotlikoff, Kent Smetters and Jan Wallsier found that reform proposals would increase GDP by between 5 and 9 percent over the long run, using a dynamic economic simulation model. (Altig, David, Alan J. Auerbach, Laurence J. Kotlikoff, Kent A. Smetters, Jan Wallsier, “Simulating Fundamental Tax Reform in the U.S.,” University of California, Berkeley, September 29, 1999). Young Lee and Roger Gordon found that a cut in the corporate tax rate by10 percentage points would increase economic growth by 1.1 to 1.8 percent annually. (Lee, Young, Roger H. Gordon, “Tax Structure and Economic Growth,” University of California, San Diego, July 15, 2004)

More recently a study by John Diamond of Rice University estimated that the Romney tax reforms will raise real GDP by about 0.6 percent per year over a decade and increase employment in the long run (above the level possible in a more robust cyclical recovery) by 7million jobs. A long-term reform would also create a more stable tax code, which adds further gains in output by increasing policy predictability. The number of provisions of the tax code expiring each year has skyrocketed from 11 in 2000-2002 to 133 in 2010-2012. The epitome of the deviations from basic principles is the self-inflicted fiscal cliff where many important provisions of the tax code change at the end of 2012. Scott Baker, Nicholas Bloom, and Stephen Davis report the quantitative impact of this uncertainty (in their paper in

Government Policies and the Delayed Economic Recovery

edited by Lee Ohanian, John Taylor, and Jan Wright).One important feature of business taxation is the link between the taxation of unincorporated business income and the investment and employment decisions of unincorporated businesses. Using estimated effects of taxation from previous research, one can calculate the change in unincorporated business investment and employment as a result of the Romney program’s proposed lower marginal tax rates, as opposed to Obama’s proposed higher marginal tax rates.(See the research in Robert Carroll, Douglas Holtz-Eakin, Mark Rider, and Harvey S. Rosen, “Entrepreneurs, Income Taxes, and Investment,” in Joel Slemrod, ed., Does Atlas Shrug?: The Economic Consequences of Taxing the Rich. Cambridge: Harvard University Press, 2000; and Robert Carroll, Douglas Holtz-Eakin, Mark Rider, and Harvey S. Rosen, “Income Taxes and Entrepreneurs’ Use of Labor,” Journal of Labor Economics, April 2000.) Using similar research methods, the decline in the top effective rate in the Romney program raises the probability that a small business undertakes additional investment by 40 percent, and augments the capital outlays of those that do expand by 54 percent. As these expansionary incentives are put in place, the demand for capital goods will rise – a fundamental of strong economic growth. The decline in the top effective rate under the Romney program would raise the probability that a small business would add to payrolls by roughly 48 percent – a significant impact. Similarly, for those firms that do additional hiring, the growth in payrolls would be enhanced by over 14 percent. Insum, tax reform that reduces marginal tax rates would benefit workers by increasing hiring and wages.

Spending and Entitlement Reform.

Recent research by John Cogan and John Taylor of Stanford University and Volker Wieland and Maik Wolters of Goethe University estimates that the output effects of a fiscal consolidation, like the Romney plan, would gradually reduce federal spending relative to GDP. In a long-run model, the fiscal consolidation raises both investment and output(the latter by almost 2 percent). In an alternative model with short-run rigidities, the spending consolidation also raises output by about 2 percent. In both cases, output rises even in the short run, as households and businesses respond to lower expected future tax rates as a result of the fiscal consolidation.

Beneficial Effects of Tax Cuts Versus Temporary Stimulus Packages.

Recent research by Alberto Alesina and Silvia Ardagna of Harvard University argues that policies to increase economic growth are more effective if done with tax cuts than with spending increases. In their conclusion, they write about the Obama stimulus: “About two-thirds of this fiscal package is constituted by increases in spending, including public investment transfers, and government consumption. According to our results, fiscal stimuli based upon tax cuts are much more likely to be growth-enhancing than those on the spending side.” (See Alberto Alesina and Silvia Ardagna, “Large Changes in Fiscal Policy: Taxes versus Spending,” in Jeffrey Brown, ed., Tax Policy and the Economy, Cambridge: MIT Press, 2009.) Separate research by Andrew Mountford of the University of London and Harald Uhlig of Humboldt University concurs: “Our key finding isthat the best fiscal policy to stimulate the economy is a deficit-financed tax cut and that long-term costs of fiscal expansion through government spending are probably greater than the short-term gains.” (See Andrew Mountford and Harald Uhlig, “What Are the Effects of Fiscal Policy Shocks?,” CEPR Discussion Paper, July 2005.) Regulatory Reform.

Recent research by Ellen McGratten and Nobel laureate Edward Prescott concludes that higher regulatory costs reduced both R&D and fixed investment during the financial crisis and its aftermath; and regulations continue to increase. Between 2009 and 2010,the number of pages devoted to final rules in the Federal Register rose from 20,782 to a 24,914 – a 20 percent increase. Stopping this growth and applying cost benefit analysis will remove impediments to investment and increase long-term growth.

Historical Comparison to the Reagan Recovery.

One historical comparison is particularly relevant in this context – the recovery from the 1981-1982 recession. In the 1981-1982 recession, the unemployment rate soared to 10.8 percent. In the 2007-2009 recession, it peaked at 10 percent.”Both downturns were rooted in financial convulsions. The 1981-1982 recession was induced by restrictive monetary policy aimed at breaking the back of double-digit inflation and interest rates, which generated a housing and savings-and-loan crisis. The more recent recession resulted from excessive government intervention to increase homeownership by expanding subprime housing loans, on which substantial leverage was built. The resulting wave of defaults damaged the base of the banking system. Fifty-three months after the start of the 1981-1982 recession, total employment in the U.S. was up 7.5 million, or almost 7.5 percent higher than when the recession began. The labor-force participation rate rose to 65 percent from 63.8 percent, as optimism about the future pulled potential workers into the job market. Real per capita gross domestic product increased by $2,870, and was 11 percent higher than when the recession started. Fifty-three months after the start of the 2007-2009 recession, however, total employment in the United States is still down four million jobs, or 2.7 percent lower than when the recession began. The labor-force participation rate has dropped to 63.8 percent from 66 percent, as discouraged workers have exited the labor market. Real per capita GDP has declined by $964, and is 2.2 percent lower today than when the recession began. If the current economy had matched the job-creation rate of the recovery from the 1981-1982 recession, there would be 15 million more Americans at work today, 8.3 million more Americans would be in the labor force, and per capita GDP would be $5,792 higher than it is today.” (Phil Gramm and Glenn Hubbard, Op-Ed, “Gramm and Hubbard: What A Romney Recovery Might Look Like, “The Wall Street Journal, 06/06/12)Policy responses in the early 1980s aimed not just at overcoming the 1981-1982 recession, but at overcoming the structural problems of the 1970s. By reducing domestic discretionary spending, setting out a three-year program to reduce tax rates, and alleviating the regulatory burden, policymakers sought to make it profitable to invest in America again. These principles match those in the Romney plan. Governor Romney would reduce the size and cost of the federal government. He champions a reduction in marginal tax rates in the context of a general tax reform. Particularly powerful are his proposals to reduce marginal tax rates on business income earned by corporate and unincorporated businesses alike.” link


The Ryan Plan: Part 3

As in Part 2 of this series, I will continue with the Introduction section of Ryan’s plan. Here is Ryan’s criticism of Cap and Trade:

Cap and Trade. This proposal effectively establishes a government takeover of most of the energy market. The legislation requires companies responsible for more than 86 percent of U.S. energy resources to obtain new emissions permits from the Federal Government to stay in business, includes a series of new mandates on the production and use of energy, and expands bureaucracies – or creates new ones – to oversee this program. Yet it fails to boost two of the most reliable sources of clean energy: nuclear and hydro-power.

By sharply increasing the cost of energy, the bill imposes substantial tax increases that will be absorbed largely by middle-income earners – breaking the President’s promise not to raise taxes for those making less than $250,000 per year. Although the measure contains a complex scheme of allowances, tax credits, and tax rebates that attempt to reduce the impact on households, the bottom line is inescapable: the higher energy costs will have to be absorbed by someone; and the “someone” will be the U.S. taxpayer. Meanwhile, in contrast to the President’s pledge to “change the way Washington works,” the legislation gives away 83 percent of its carbon allowances to energy- and climate-related special interests, at the expense of U.S. taxpayers.

Yet after all this, the benefits of cap-and-trade remain highly doubtful. Some studies show the scheme might move temperatures by no more than a fraction of a degree by the end of this century – which would make little difference on whatever climate effects result from greenhouse gas emissions. There are no effective limits on emissions by foreign countries, such as China and India, that are responsible for the fastest current growth in greenhouse gases.

Mitt Romney is equally critical of Cap and Trade in his book:

“I am uncertain how much of the warming, however, is attributable to man and how much is attributable to factors out of our control. I do not support radical feel-good policies like a unilateral U.S. cap-and-trade mandate. Such policies would have little effect on climate but could cripple economic growth with devastating results for people across the planet.” – Mitt Romney No Apology, p. 227

His web site also states this policy position:

Summary: Mitt Romney on Cap and Trade/Global Warming

Cap and Trade legislation would be disastrous for our economy.

The earth’s climate has been constantly changing throughout its history.

We should not take extreme measures when we are unsure of human role in global warming.

Treaties, like Kyoto, would affect the U.S., but not major greenhouse gas emitters like China and India.

However, he previously stated this about Cap and Trade:

In 2005, Romney Said Cap-And-Trade Was “Good For Business”

2005: Romney Endorsed Cap-And-Trade, Saying “We Can Effectively Create Incentives To Help Stimulate A Sector Of The Economy And At The Same Time Not Kill Jobs. … I’m Convinced It Is Good Business.” According to the Boston Globe:

Governor Mitt Romney signaled his support yesterday for a regional agreement among Northeastern states to reduce greenhouse gas emissions, despite opposition from power companies and other business interests that have been lobbying the administration against the plan.

In opening remarks to a clean-energy conference in Boston, Romney said the first-of-its-kind agreement, under which Massachusetts and eight other states could be required to cut power plant emissions by 2020, will not hurt the economy, as some have charged. He argued that it would spur businesses to develop clean- and renewable-energy technology to market worldwide.

”This is a great thing for the Commonwealth,” Romney said, his strongest endorsement of the pact to date. ”We can effectively create incentives to help stimulate a sector of the economy and at the same time not kill jobs.”

[…]

”I’m convinced it is good business,” Romney said. [Boston Globe, 11/8/05]

Additionally, Romney was fact checked on this statement:

Romney Blatantly Flaunts False Cost Estimate For Clean Energy Jobs Legislation

October 07, 2009 1:13 pm ET

On October 7, 2009, Mitt Romney’s Free and Strong America PAC sent an email to supporters falsely claiming clean energy jobs legislation would raise costs by $1,761 per household and kill jobs. In reality, legislation increasing our investment in clean energy technologies would create jobs in every state and help America become more energy independent, all for less than a quarter a day.

Mitt Romney Repeated False Cost Estimate

Mitt Romney:

In fact, estimates are that the Obama plan could cost the average American family $1,761 a year, the equivalent of a 15% income tax hike. It will kill jobs and make a bad economic situation even worse. [Romney’s Free & Strong America PAC email, 10/7/09]

The Report Cited Analyzed A Completely Different Plan, Rendering It Irrelevant

PolitiFact.com Rated Claim FALSE: “His Statement That Households Will Pay $1,761 In New Taxes Every Year Is Based On A Blogger’s Incorrect Assumptions And Overly Simple Math.” According to PolitiFact.com: “His statement that households will pay $1,761 in new taxes every year is based on a blogger’s incorrect assumptions and overly simple math. The estimate does not account for revenue that will be returned to consumers in the form of rebates and other efficiency measures. Furthermore, the number is based on old numbers; the Treasury estimate was written on the premise that all permits would be sold, which, ultimately, is not the form that the Waxman-Markey legislation has taken. Finally, both Alexander and McCullagh portray money raised by selling these permits as a tax. We rate Alexander’s claim False.” [PolitiFact.com, 9/16/09]

Bloomberg: “85 Percent Of The Cap-And-Trade Permits Would Be Given Away In The Early Years.” As reported by Bloomberg: “85 percent of the cap-and-trade permits would be given away in the early years of a proposed climate-change program that House Energy and Commerce Committee Chairman Henry Waxman, a California Democrat, wants his panel to pass next week. The biggest recipient, the electricity sector, would get 35 percent of the permits, also known as allowances or credits. Others that would receive a large share of the permits for free are energy-intensive manufacturers, natural gas distributors, automakers, and U.S. states with renewable energy and energy efficiency programs.” [Bloomberg, 5/15/09]

Washington Post: “The Plan In The March Treasury Memo Is Not The One Being Debated In Congress.” In an article describing the records obtained by the Competitive Enterprise Institute, the Washington Post wrote “the plan in the March Treasury memo is not the one being debated in Congress.” [Washington Post, 9/17/09]

Treasury Department: “The Reporting On The Treasury Analysis Is Flat Out Wrong.” According to the Washington Post, “The Treasury said the furor was much ado about little. The March memo was not based on any independent Treasury analysis and summarized other studies. The transition team memo said that the government could use the revenue to ‘offset distortionary taxes on labor or capital.’ ‘The reporting on the Treasury analysis is flat out wrong,’ said Alan B. Krueger, Treasury assistant secretary for economic policy.” [Washington Post, 9/17/09]

Clean Energy Jobs Legislation Would Rebuild America For A Postage Stamp A Day

Reuters: “Climate Legislation Moving Through Congress Would Have Only A Modest Impact On Consumers.” According to Reuters: “A new U.S. government study on Tuesday adds to a growing list of experts concluding that climate legislation moving through Congress would have only a modest impact on consumers, adding around $100 to household costs in 2020. Under the climate legislation passed by the House of Representatives in June, electricity, heating oil and other bills for average families will rise $134 in 2020 and $339 in 2030, according to the Energy Information Administration, the country’s top energy forecaster.” [Reuters, 8/5/09]

EIA: Clean Energy Legislation Would Cost Only $0.23 Per Day. According to a House Energy and Commerce Committee factsheet of the Energy Information Administration’s analysis of the American Clean Energy and Security Act: “The U.S. Energy Information Administration (EIA) has completed an analysis of the American Clean Energy and Security Act (H.R. 2454), as passed by the U.S. House of Representatives… The overall impact on the average household, including the benefit of many of the energy efficiency provisions in the legislation, would be 23 cents per day ($83 per year). This is consistent with analyses by the Congressional Budget Office which projects a cost of 48 cents per day ($175 per year) and the Environmental Protection Agency which projects a cost of 22 to 30 cents per day ($80 to $111 per year).” [House Energy and Commerce Committee, EIA’s Economic Analysis Of “The American Clean Energy And Security Act Of 2009,” 8/4/09; emphasis original]

CBO: In 2020, Cap-And-Trade Will Only Cost An Average Of $175 Annually, “About A Postage Stamp A Day.” In its analysis of the American Clean Energy and Security Act, the Congressional Budget Office wrote: “On that basis, the Congressional Budget Office (CBO) estimates that the net annual economy wide cost of the cap-and-trade program in 2020 would be $22 billion-or about $175 per household.” Rep. Edward Markey noted it was “the cost of about a postage stamp a day.” [CBO, 6/19/09; House Committee on Energy & Commerce Release, 6/20/09]

• Cap-And-Trade Would DECREASE Energy Prices For Low-Income Americans. In its analysis of the American Clean Energy and Security Act, the Congressional Budget Office wrote, “households in the lowest income quintile would see an average net benefit of about $40 in 2020.” [CBO, 6/19/09; emphasis original]

Investment In Clean Energy Technology Will Create Millions Of American Green Jobs

As Media Matters Action Network has noted, a recent study from UC Berkeley found that pollution reduction and energy efficiency measures would create up to 1.9 million jobs, boost GDP by up to $111 billion and increase families’ incomes by nearly $1,200 per year!

Investment In Clean Energy Technology Will Create Over 1.7 Million American Jobs. According to the Center for American Progress: “Investments in a clean-energy economy will generate major employment benefits for the entire U.S. economy. Our research finds that spending $150 billion on clean-energy investments would create roughly 1.7 million jobs. This is even after assuming a reduction in fossil fuel spending equivalent to the increase in clean-energy investments.” [Center for American Progress, The Economic Benefits of Investing in Clean Energy, 6/17/09]

• Every Single State Will Gain Jobs From An Investment In Clean Energy Technologies. According to the Center for American Progress, investments in clean energy projects would create 1.7 million American jobs in every state in the country. [Center for American Progress, The Economic Benefits of Investing in Clean Energy, 6/17/09]

Investment In Clean Energy Technology Creates FOUR TIMES As Many Jobs As An Investment In Oil & Gas. According to the Center for American Progress, “spending $1 million on energy efficiency and renewable energy produces a much larger expansion of employment than spending the same amount on fossil fuels or nuclear energy. Among fossil fuels, job creation in coal is about 32 percent greater than that for oil and natural gas. The employment creation for energy efficiency-retrofitting and mass transit-is 2.5 times to four times larger than that for oil and natural gas. With renewable energy, the job creation ranges between 2.5 times to three times more than that for oil and gas.” [Center for American Progress, The Economic Benefits of Investing in Clean Energy, 6/17/09]

Investment In Renewable Energy Has Already Salvaged Many Manufacturing Facilities Closed During Economic Downturn. Across America, factories and plants abandoned by the old economy have been re-tooled and re-opened to satisfy the growing demand for new energy technologies. For instance, once hopeless manufacturing plants in Pennsylvania, Iowa, and Michigan have re-energized their communities by creating jobs and leading the charge toward a new energy future. [Bloomberg, 4/2/09; Star Tribune, 4/22/09; Grand Rapids Press, 3/6/08]

Here is a little history on Cap and Trade policies:

A little history is in order. Cap and trade was developed as a more flexible, market-based system to reduce environmental pollution compared to the so-called “command and control” model employed by environmental laws in the 1970s. The old system required each polluting facility to make a fixed reduction in air or water contamination, which ignored that some facilities could cut pollution more cheaply than others.

Cap and trade is a cost-effective alternative that allows the firms that can more cheaply reduce their emissions below their required limit to sell any additional reductions to companies that are not able to make reductions as easily. This creates a system that guarantees a set level of overall reductions while rewarding the most efficient companies and ensuring that the cap can be met at the lowest possible cost to the economy.

The Reagan White House conceived the first cap-and-trade program to reduce pollution. It was used in the 1980s to phase out lead in gasoline at a lower cost. An EPA analysis shows:

…estimated savings from the lead trading program of approximately 20 percent over alternative programs that did not provide for lead banking, a cost savings of about $250 million per year.

President Reagan also signed the Montreal Protocol in 1987 to slash the production and use of chemicals that deplete the upper ozone layer essential to screen out cancer-causing ultraviolet rays. His administration established a cap-and-trade system to implement the chemical reductions the protocol required. A 2006 scientific assessment concluded that “the Montreal Protocol is working” to reduce chemicals and protect the ozone layer.

President George H.W. Bush, Reagan’s successor, was the first president to propose the employment of a cap-and-trade system in an environmental law. The Clean Air Act of 1990 includes his proposed cap-and-trade system to reduce the sulfur pollution from power plants responsible for acid rain.

The Clean Air Act passed the Senate by a vote of 89-10 and the House by 401-25. Many staunch conservatives voted for it including Sens. Kit Bond (R-Mo), Trent Lott (R-MS), Mitch McConnell (R-KY), and Strom Thurmond (R-SC). Conservative House supporters included Reps. Newt Gingrich (R-GA), Joe Barton (R-TX), Dennis Hastert (R-IL), Jim Inhofe (R-OK), and Fred Upton (R-MI).

When President Bush signed the Clean Air Act into law he highlighted its innovative cap-and-trade mechanism:

The acid rain allowance trading program will be the first large-scale regulatory use of market incentives and is already being seen as a model for regulatory reform efforts here and abroad.

By employing a system that generates the most environmental protection for every dollar spent, the trading system lays the groundwork for a new era of smarter government regulation; one that is more compatible with economic growth than using only the command and control approaches of the past.

President Bush’s prediction came true. An EPA analysis a decade after the law was passed determined that the actual cost of cutting sulfur emissions by 40 percent was substantially lower than it had predicted: “$1 to $2 billion per year, just one quarter of original EPA estimates.” A CAP analysis determined that in 2006 utility rates were 5 percent lower (in real dollars) than before the act passed in 1990. And the U.S. economy added 16 million jobs during this time.

President George W. Bush also included a cap-and-trade mechanism in his “Clear Skies” bill that would have amended the Clean Air Act. Upon the bill’s introduction he noted the success of his father’s cap-and-trade program:

The 1990 Clean Air Act Amendments have significantly reduced air pollution, especially through the innovative “cap-and trade” acid rain control program. [It] has been a resounding success, cutting annual sulfur dioxide emissions in the first phase by 50 percent below allowed levels. Emissions were reduced faster than required, and at far less cost…The program only requires a handful of EPA employees to operate.

Sen. John McCain (R-AZ) introduced several global warming pollution reductions bills during the previous decade. While running for president in 2008 McCain proposed to reduce global warming pollution via a cap-and-trade program.

John McCain’s climate plan will be similar to the very successful acid rain trading program created under the first President Bush in the early 1990s.

A cap-and-trade system sends a market signal that organizes the whole economy around our environmental goals…The market evolves by requiring sensible reductions in greenhouse gases, but also allowing full flexibility in how industry meets that requirement.

Then-Gov. Sarah Palin (R-AK) also supported a cap-and-trade system to reduce global warming pollution as the GOP nominee for vice president. She reiterated that support (see 34:00) during the vice presidential debate.

Former Speaker of the House Newt Gingrich (R-GA) also endorsed a cap-and-trade system to reduce global warming pollution in 2007:

I think if you have mandatory carbon caps combined with a trading system, much like we did with sulfur, and if you have a tax-incentive program for investing in the solutions, that there’s a package there that’s very, very good. And frankly, it’s something I would strongly support.

Gingrich has changed his tune, however, just two years later. He railed against the “cap-and-trade energy tax” in 2009.

The Koch brothers largely financed a scientific undertaking to prove that global warming was a lie. Unfortunately, the data indicated the Koch brothers were really the liars. As the article points out, their current position on climate change varies depending on their audience. The project employed huge amounts of data coming from different sources and used assumptions that conservatives were using to criticize global warming. Here is what the data showed:

AND, the warming appears to be human caused:

This is what the founder of the research project wrote in an op-ed piece of the New York Times.

Also, see this for more information.

The Economist had this to say.

Here is the Koch brothers current, official position.

The data for warming looks like an exponential curve. You have seen this before with the national debt. After decades of Republican and Democratic policies including the largest most recent contribution by President Bush which set us on the exponential path to a debt crisis, the Republicans are blaming President Obama for the crisis. Could it be that in the next presidential election the Republicans will blame the Democrats for the climate change crisis?…sophistry works well in capitalism as truth is up for the highest bidder

The bottom line is that the Republicans have been all over the map on this issue. Initially, they attacked it as a liberal lie. Now, they are faced with data that indicates climate change is not a liberal lie but real AND it appears to be human caused. Is this Republican leadership? Could it be that it may be in some corporatist energy group’s interest to downplay science in favor of ‘free market interests’? I will let the reader’s logic provide the answer.